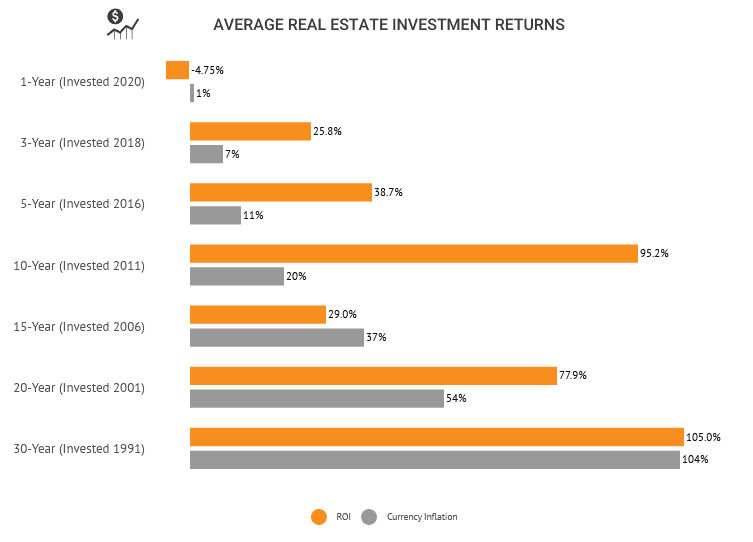
Highlights. Economists expect the average real estate return on investment (ROI) to improve, though values have not risen as much as expected at the start of the year.
- From January 2020 to February 2022, the average home price index grew 35.1%.
- The average year-over-year (YOY) ROI was 0.20% in early May 2022, down 98.2% from October 2021.
- The average 5-year ROI was in May 2022 4.16%, down 48.6% from October 2021.
- Low-rise apartment buildings are among the most lucrative with an average 9.0% ROI.
- $8,190 is the average total net return for an apartment unit.
| Property Type | 1-Year ROI | 1-Year Net* |
|---|---|---|
| Average Industrial | 9.5% | $8.16/ft2 |
| Low-Rise Apartments | 9.0% | $11.88/ft2 |
| Multi-Family Home | 7.6% | $7.69/ft2 |
| Average Residential | 7.5% | $11.64/ft2 |
| New Single Family Home | 1.32% | $2.03/ft2 |
*Annual net refers only to equity; operating expenses and income are excluded. (Were they included, this would be referred to as the “total annual net”.)
Real Estate Investment Properties
COVID-19 significantly affected certain commercial and residential property investments, especially hotels and urban rentals.
- Mid- and high-rise apartments of the type only found in cities currently offer the lowest 1-year ROI at -9.0%, averaging a loss of $27,070.69 per unit.
- Large hotels currently offer the second lowest 1-year ROI of any real estate investment at -$21,335 per room, averaging a 7.2% loss.
- Real estate is generally categorized as either residential or commercial property.
- Residential real estate includes single family homes, multi-family homes, apartment buildings, and condominiums.
- Commercial real estate includes office buildings, retail spaces, hotels, warehouses, and anywhere else business is the primary purpose.
- Large apartment complexes that include office space may be considered flex or commercial real estate.
Residential Real Estate
Beginning investors usually look into small residential properties. Residential real estate is a more conservative investment than commercial real estate, offering consistently fair returns.
- In October 2021, a new single family home had a total net 1-year ROI of $5,082.23.
- The average single family home had a 1-year ROI of $184.22 in late 2021.
- The average home owners hold on to their property for 8.17 years.
- Smaller apartment buildings and multi-family homes offer a significantly better return than large complexes.
- Suburban homes offer significantly better returns than urban homes.
- Vacation rentals and Airbnbs may be considered residential real estate for tax and zoning purposes.
Property Type1-Year ROI1-Year Net*
| Mid- or High-Rise Apartments | -9.0% | -$24.41/ft2 |
| Garden/Low-Rise Apartments | 9.0% | $11.88/ft2 |
| Average Residential Property | 7.5% | $11.64/ft2 |
| Multi-Family Home | 7.6% | $7.69/ft2 |
| New Single Family Home | 1.32% | $2.03/ft2 |
| Average Single Family Home | 0.07% | $0.09/ft2 |
| Average Apartment Building | -0.9% | -$1.61/ft2 |
*Annual net refers only to equity; operating expenses and income are excluded. (Were they included, this would be referred to as the “total annual net”.)
Short-Term Rental
Vacation homes and Airbnbs rent for higher prices than long-term apartments. Some of that is due to additional wear and tear, which drives up operating costs.
- The average Airbnb rents for $185 per night.
- Occupancy averages 48%.
- At 100% occupancy, the average Airbnb would return $5,735 per month in rent.
- 83% of travelers prefer vacation rentals near a large body of water.
- Among them, 89% specifically want a beach nearby.
- Following a financial dip in 2020, investors show confidence vacation rentals will become more lucrative in the coming year.
- Investors spent $2 billion dollars on Airbnb throughout the year after COVID-19 was declared a pandemic.
- Travelers are 18% more likely to consider vacation rentals a less significant health risk than hotels.
- Airbnb reports a 20% increase in stays of 28 days or longer.
- 95% of vacation rental operators plan to implement safety-inspired technology, such as remote and touchless check-in processes.
- Processing remote check-ins is an average of 80% faster than manual registration.

Apartment Rental
Long-term apartment rentals don’t offer as much potential cash flow as short-term rentals. They may be more cost effective in the long run, however, due to fewer unknown variables, such as vacancy rates.
- The total net 1-year ROI for the average apartment (including lost market value) is $8,190.22.
- The 1-year ROI on the average garden/low-rise apartment is $13,370.
- After operating expenses, the average apartment nets $9,976.70 annually in rent.
- Operating expenses increased 2.6% in 2020.
- Insurance costs increased 19%.
- Annual operating expenses for an apartment property average $7.70 per square foot.
- Garden and low-rise apartments cost $6.61 per square foot per year while mid- to high-rise apartments cost $9.60 per square foot to operate.
- The average 2-bedroom apartment rents for $1,543 per month or $18,516 per year.
- The average apartment size is 1,109 ft2.
- At the end of 2020, market absorption held steady at 60% (its highest point in 5 years), indicating a seller’s market.
- Rent prices fell 5.91% from 2019 to 2020.
- Large apartment complexes may fall under commercial zoning.
Single Family Home Rental
Small properties usually cost much less per square foot than larger complexes. Single family home rentals also tend to have less turnover than apartments, meaning less vacancy as well as wear and tear.
- An average single family rental has a total net ROI of $10,637.
- The national average rent for a single family home is $1,742 per month or $20,904 per year.
- After operating and capital expenses, rent alone nets $10,452.
- For a new single family rental, this is a total ROI of $15,534.
- Nationwide, single family rental assets total $2.3 trillion.
- Home rental vacancies are lowest in Massachusetts, New Hampshire, and Rhode Island.
- Alabama, Kansas, and Oklahoma have the highest rates of rental home vacancy.
- California has the most lucrative single family rental market.
- The West region of the United States has the lowest rate of homeownership at 59.3%.
- West Virginia’s single family rental market is the least lucrative nationwide.
Single Family Home Purchase ROI by State
Single family home purchases, including owner-occupied homes, generally appreciate in value over the long-term. Location, maintenance, and local weather can all influence the rate of return.
- Single family homes in Utah offer the highest ROI over the short- and long-term.
- Colorado, Idaho, and Montana are all states where a single family home purchase historically offers a high ROI.
- Connecticut single family homes historically has a low ROI.
- The average 1-year return on investment among states was 17.0% in 2021Q4 (this is not the same as the national average).
- The District of Columbia has the lowest 1-year return and is the only market to experience loss of value between 2021Q3 and 2021Q4.
| State | 1-Quarter ROI | 1-Year ROI |
|---|---|---|
| Alabama | 4.07% | 17.57% |
| Alaska | 1.64% | 11.29% |
| Arizona | 4.64% | 27.42% |
| Arkansas | 5.16% | 19.21% |
| California | 3.57% | 19.62% |
| Colorado | 2.42% | 18.20% |
| Connecticut | 1.97% | 13.63% |
| Delaware | 3.51% | 15.11% |
| District of Columbia | -1.88% | 6.61% |
| Florida | 5.20% | 25.65% |
| Georgia | 4.96% | 20.89% |
| Hawaii | 3.95% | 20.16% |
| Idaho | 1.78% | 27.02% |
| Illinois | 2.46% | 12.54% |
| Indiana | 2.72% | 14.62% |
| Iowa | 2.24% | 11.60% |
| Kansas | 2.23% | 12.97% |
| Kentucky | 1.92% | 13.83% |
| Louisiana | 0.86% | 10.18% |
| Maine | 2.94% | 20.17% |
| Maryland | 2.32% | 10.77% |
| Massachusetts | 2.31% | 14.83% |
| Michigan | 2.89% | 15.42% |
| Minnesota | 2.24% | 12.80% |
| Mississippi | 5.29% | 17.54% |
| Missouri | 2.55% | 14.94% |
| Montana | 4.28% | 23.78% |
| Nebraska | 2.54% | 14.52% |
| Nevada | 3.37% | 23.03% |
| New Hampshire | 3.13% | 18.46% |
| New Jersey | 3.19% | 15.37% |
| New Mexico | 3.18% | 15.66% |
| New York | 2.11% | 13.38% |
| North Carolina | 4.00% | 21.13% |
| North Dakota | 2.34% | 10.32% |
| Ohio | 2.60% | 13.53% |
| Oklahoma | 3.60% | 16.59% |
| Oregon | 2.74% | 18.05% |
| Pennsylvania | 2.56% | 13.32% |
| Rhode Island | 2.50% | 16.93% |
| South Carolina | 5.48% | 21.41% |
| South Dakota | 4.17% | 20.06% |
| Tennessee | 5.38% | 24.10% |
| Texas | 3.82% | 19.33% |
| Utah | 3.86% | 27.05% |
| Vermont | 2.97% | 20.00% |
| Virginia | 2.21% | 13.41% |
| Washington | 3.91% | 20.12% |
| West Virginia | 1.84% | 12.03% |
| Wisconsin | 2.37% | 13.53% |
| Wyoming | 4.05% | 15.83% |
Alabama Home Purchase Returns
Alabama is one of only four (4) states where the average mortgage balance is higher than the median home value.
- Homes in Alabama rose 4.1% in value between the third and fourth financial quarters in 2021.
- In one year, median home values in Alabama increased 17.6% from 2020Q4 to 2021Q4.
- Over five (5) years, Alabama home values increased 53.2% or an average quarterly rate of 2.7%.
- From 1991Q1 to 2021Q4, home values increased at a 6.2% quarterly rate.
- The median home value was $134,300 in September 2019.
- Alabama home values theoretically increased $35,744 between September 2019 and March 2022.
- The average outstanding mortgage balance in September 2019 was $141,302 or 105.2% of the value a typical home in Alabama.
Alaska Home Purchase Returns
Alaska’s median home value is far above the average among states, but home values haven’t appreciated as dramatically over the short- or long-term.
- Homes in Alaska rose 1.6% in value between the third and fourth financial quarters in 2021.
- Median home values in Alaska increased 11.3% from 2020Q4 to 2021Q4.
- Over five (5) years, Alaska home values increased 28.7% or an average quarterly rate of 1.4%.
- From 1991Q1 to 2021Q4, home values increased at a 6.6% quarterly rate.
- The median home value was $326,000 in September 2019.
- Alaska home values theoretically increased $46,814 between September 2019 and March 2022.
- The average outstanding mortgage balance in September 2019 was $223,167 or 68.5% of the value a typical home in Alaska.
Arizona Home Purchase Returns
Arizona’s median home value is slightly higher than the average among states, and home values have significantly increased in value over the short- and long-term.
- Homes in Arizona rose 4.6% in value between the third and fourth financial quarters in 2021.
- Median home values in Arizona increased 27.4% from 2020Q4 to 2021Q4.
- Over five (5) years, Arizona home values increased 84.2% or an average quarterly rate of 4.2%.
- From 1991Q1 to 2021Q4, home values increased at a 12.2% quarterly rate.
- The median home value was $257,600 in September 2019.
- Arizona home values theoretically increased $108,411 between September 2019 and March 2022.
- The average outstanding mortgage balance in September 2019 was $202,959 or 78.8% of the value a typical home in Arizona.
Arkansas Home Purchase Returns
Arkansas’ median home value is far below the average among states; home values have increased at a steady rate over the short-term but have below-average gains in the long-term.
- Homes in Arkansas rose 5.2% in value between the third and fourth financial quarters in 2021.
- Median home values in Arkansas increased 19.2% from 2020Q4 to 2021Q4.
- Over five (5) years, Arkansas home values increased 48.5% or an average quarterly rate of 2.4%.
- From 1991Q1 to 2021Q4, home values increased at a 6.0% quarterly rate.
- The median home value was $129,500 in September 2019.
- Arkansas home values theoretically increased $31,397 between September 2019 and March 2022.
- The average outstanding mortgage balance in September 2019 was $129,383 or 99.9% of the value a typical home in Arkansas.
California Home Purchase Returns
California’s median home value is among the highest among states, and home values have risen at increasingly higher rates over the short- and long-term.
- Homes in California rose 3.6% in value between the third and fourth financial quarters in 2021.
- Median home values in California increased 19.6% from 2020Q4 to 2021Q4.
- Over five (5) years, California home values increased 58.2% or an average quarterly rate of 2.9%.
- From 1991Q1 to 2021Q4, home values increased at a 8.8% quarterly rate.
- The median home value was $550,800 in September 2019.
- California home values theoretically increased $160,338 between September 2019 and March 2022.
- The average outstanding mortgage balance in September 2019 was $363,891 or 66.1% of the value a typical home in California.
Colorado Home Purchase Returns
Colorado’s median home value is far above the average among states, and home values have increased at nearly double the average rate among states over the long-term.
- Homes in Colorado rose 2.4% in value between the third and fourth financial quarters in 2021.
- Median home values in Colorado increased 18.2% from 2020Q4 to 2021Q4.
- Over five (5) years, Colorado home values increased 62.5% or an average quarterly rate of 3.1%.
- From 1991Q1 to 2021Q4, home values increased at a 16.2% quarterly rate.
- The median home value was $381,300 in September 2019.
- Colorado home values theoretically increased $119,080 between September 2019 and March 2022.
- The average outstanding mortgage balance in September 2019 was $259,113 or 68.0% of the value a typical home in Colorado.
Connecticut Home Purchase Returns
Connecticut’s median home value is on par with the average among states, and home values have been slow to increase over the short- and long-term.
- Homes in Connecticut rose 2.0% in value between the third and fourth financial quarters in 2021.
- Median home values in Connecticut increased 13.6% from 2020Q4 to 2021Q4.
- Over five (5) years, Connecticut home values increased 38.7% or an average quarterly rate of 1.9%.
- From 1991Q1 to 2021Q4, home values increased at a 3.9% quarterly rate.
- The median home value was $244,800 in September 2019.
- Connecticut home values theoretically increased $47,357 between September 2019 and March 2022.
- The average outstanding mortgage balance in September 2019 was $224,928 or 91.9% of the value a typical home in Connecticut.
Delaware Home Purchase Returns
Delaware’s median home value is on par with the average among states; home values have steadily increased over the short-term, with slightly below-average returns in the long-term.
- Homes in Delaware rose 3.5% in value between the third and fourth financial quarters in 2021.
- Median home values in Delaware increased 15.1% from 2020Q4 to 2021Q4.
- Over five (5) years, Delaware home values increased 43.1% or an average quarterly rate of 2.2%.
- From 1991Q1 to 2021Q4, home values increased at a 5.2% quarterly rate.
- The median home value was $236,300 in September 2019.
- Delaware home values theoretically increased $50,946 between September 2019 and March 2022.
- The average outstanding mortgage balance in September 2019 was $185,527 or 78.5% of the value a typical home in Delaware.
District of Columbia Home Purchase Returns
D.C.’s median home value is among the highest in the nation; while long-term returns have been phenomenal, home values have appreciated at a slower rate or declined in the short-term.
- Homes in D.C. declined 1.9% in value between the third and fourth financial quarters in 2021.
- Median home values in D.C. increased 6.6% from 2020Q4 to 2021Q4.
- Over five (5) years, D.C. home values increased 31.2% or an average quarterly rate of 1.6%.
- From 1991Q1 to 2021Q4, home values increased at a 15.9% quarterly rate.
- The median home value was $567,800 in September 2019.
- D.C. home values theoretically increased $88,690 between September 2019 and March 2022.
- The average outstanding mortgage balance in September 2019 was $421,499 or 74.2% of the value a typical home in D.C.
Florida Home Purchase Returns
Florida’s median home value is slightly lower than the average among states but returns are well above average.
- Homes in Florida rose 5.2% in value between the third and fourth financial quarters in 2021.
- Median home values in Florida increased 25.7% from 2020Q4 to 2021Q4.
- Over five (5) years, Florida home values increased 72.0% or an average quarterly rate of 3.6%.
- From 1991Q1 to 2021Q4, home values increased at a 10.8% quarterly rate.
- The median home value was $237,900 in September 2019.
- Florida home values theoretically increased $85,585 between September 2019 and March 2022.
- The average outstanding mortgage balance in September 2019 was $188,223 or 79.1% of the value a typical home in Florida.
Georgia Home Purchase Returns
Georgia’s median home value is much lower than the average among states; home values appreciated faster in the short-term than they have over 30+ years.
- Homes in Georgia rose 5.0% in value between the third and fourth financial quarters in 2021.
- Median home values in Georgia increased 20.9% from 2020Q4 to 2021Q4.
- Over five (5) years, Georgia home values increased 65.1% or an average quarterly rate of 3.3%.
- From 1991Q1 to 2021Q4, home values increased at a 7.4% quarterly rate.
- The median home value was $193,500 in September 2019.
- home values theoretically increased $62,936 between September 2019 and March 2022.
- The average outstanding mortgage balance in September 2019 was $175,086 or 90.5% of the value a typical home in Georgia.
Hawaii Home Purchase Returns
Hawaii’s median home value is the highest among states nationwide; home values appreciated faster in the short-term than they have over 30+ years.
- Homes in Hawaii rose 4.0% in value between the third and fourth financial quarters in 2021.
- Median home values in Hawaii increased 20.2% from 2020Q4 to 2021Q4.
- Over five (5) years, Hawaii home values increased 46.6% or an average quarterly rate of 2.3%.
- From 1991Q1 to 2021Q4, home values increased at a 7.3% quarterly rate.
- The median home value was $619,000 in September 2019.
- Hawaii home values theoretically increased $144,072 between September 2019 and March 2022.
- The average outstanding mortgage balance in September 2019 was $345,963 or 55.9% of the value a typical home in Hawaii.
Idaho Home Purchase Returns
Idaho’s median home value is above the average among states, and home values have consistently appreciated at a faster rate than the average among states.
- Homes in Idaho rose 1.8% in value between the third and fourth financial quarters in 2021.
- Median home values in Idaho increased 27.0% from 2020Q4 to 2021Q4.
- Over five (5) years, Idaho home values increased 118.2% or an average quarterly rate of 5.9%.
- From 1991Q1 to 2021Q4, home values increased at a 14.6% quarterly rate.
- The median home value was $274,200 in September 2019.
- Idaho home values theoretically increased $162,011 between September 2019 and March 2022.
- The average outstanding mortgage balance in September 2019 was $171,193 or 62.4% of the value a typical home in Idaho.
Illinois Home Purchase Returns
Illinois’s median home value is much lower than the average among states, and home values have appreciated at a much slower rate over the short- and long-term.
- Homes in Illinois rose 2.5% in value between the third and fourth financial quarters in 2021.
- Median home values in Illinois increased 12.5% from 2020Q4 to 2021Q4.
- Over five (5) years, Illinois home values increased 32.1% or an average quarterly rate of 1.6%.
- From 1991Q1 to 2021Q4, home values increased at a 4.6% quarterly rate.
- The median home value was $183,500 in September 2019.
- Illinois home values theoretically increased $29,433 between September 2019 and March 2022.
- The average outstanding mortgage balance in September 2019 was $176,425 or 96.1% of the value a typical home in Illinois.
Indiana Home Purchase Returns
Indiana’s median home value is far below the average among states, and home values have generally been slower to appreciate.
- Homes in Indiana rose 2.7% in value between the third and fourth financial quarters in 2021.
- Median home values in Indiana increased 14.6% from 2020Q4 to 2021Q4.
- Over five (5) years, Indiana home values increased 56.1% or an average quarterly rate of 2.8%.
- From 1991Q1 to 2021Q4, home values increased at a 5.7% quarterly rate.
- The median home value was $148,700 in September 2019.
- Indiana home values theoretically increased $41,681 between September 2019 and March 2022.
- The average outstanding mortgage balance in September 2019 was $120,567 or 81.1% of the value a typical home in Indiana.
Iowa Home Purchase Returns
Iowa’s median home value is far below the average among states, and home values have been slow to increase over the short- and long-term.
- Homes in Iowa rose 2.2% in value between the third and fourth financial quarters in 2021.
- Median home values in Iowa increased 11.6% from 2020Q4 to 2021Q4.
- Over five (5) years, Iowa home values increased 35.5% or an average quarterly rate of 1.8%.
- From 1991Q1 to 2021Q4, home values increased at a 6.2% quarterly rate.
- The median home value was $146,500 in September 2019.
- Iowa home values theoretically increased $26,033 between September 2019 and March 2022.
- The average outstanding mortgage balance in September 2019 was $131,494 or 89.8% of the value a typical home in Iowa.
Kansas Home Purchase Returns
Kansas’ median home value is far below the average among states, and home values have been slow to increase over the short- and long-term.
- Homes in Kansas rose 2.2% in value between the third and fourth financial quarters in 2021.
- Median home values in Kansas increased 13.0% from 2020Q4 to 2021Q4.
- Over five (5) years, Kansas home values increased 44.9% or an average quarterly rate of 2.2%.
- From 1991Q1 to 2021Q4, home values increased at a 6.8% quarterly rate.
- The median home value was $141,500 in September 2019.
- Kansas home values theoretically increased $31,795 between September 2019 and March 2022.
- The average outstanding mortgage balance in September 2019 was $138,437 or 97.8% of the value a typical home in Kansas.
Kentucky Home Purchase Returns
Kentucky’s median home value is far below the average among states, and home values have been slow to increase over the short- and long-term.
- Homes in Kentucky rose 1.9% in value between the third and fourth financial quarters in 2021.
- Median home values in Kentucky increased 13.8% from 2020Q4 to 2021Q4.
- Over five (5) years, Kentucky home values increased 48.0% or an average quarterly rate of 2.4%.
- From 1991Q1 to 2021Q4, home values increased at a 6.6% quarterly rate.
- The median home value was $148,400 in September 2019.
- Kentucky home values theoretically increased $35,594 between September 2019 and March 2022.
- The average outstanding mortgage balance in September 2019 was $126,485 or 85.2% of the value a typical home in Kentucky.
Louisiana Home Purchase Returns
Louisiana’s median home value is far below the average among states, and home values have increased at a glacial pace in recent years.
- Homes in Louisiana rose 0.9% in value between the third and fourth financial quarters in 2021.
- Median home values in Louisiana increased 10.2% from 2020Q4 to 2021Q4.
- Over five (5) years, Louisiana home values increased 25.9% or an average quarterly rate of 1.3%.
- From 1991Q1 to 2021Q4, home values increased at a 7.1% quarterly rate.
- The median home value was $147,600 in September 2019.
- Louisiana home values theoretically increased $19,107 between September 2019 and March 2022.
- The average outstanding mortgage balance in September 2019 was $151,851 or 102.9% of the value a typical home in Louisiana.
Maine Home Purchase Returns
Maine’s median home value is slightly below the average among states, and home values have increased at an average or above-average pace over the short- and long-term.
- Homes in Maine rose 2.9% in value between the third and fourth financial quarters in 2021.
- Median home values in Maine increased 20.2% from 2020Q4 to 2021Q4.
- Over five (5) years, Maine home values increased 62.9% or an average quarterly rate of 3.1%.
- From 1991Q1 to 2021Q4, home values increased at a 8.2% quarterly rate.
- The median home value was $237,800 in September 2019.
- Maine home values theoretically increased $74,788 between September 2019 and March 2022.
- The average outstanding mortgage balance in September 2019 was $138,554 or 58.3% of the value a typical home in Maine.
Maryland Home Purchase Returns
Maryland’s median home value is above the average among states, but home values have been slow to increase over the short- and long-term.
- Homes in Maryland rose 2.3% in value between the third and fourth financial quarters in 2021.
- Median home values in Maryland increased 10.8% from 2020Q4 to 2021Q4.
- Over five (5) years, Maryland home values increased 33.9% or an average quarterly rate of 1.7%.
- From 1991Q1 to 2021Q4, home values increased at a 6.4% quarterly rate.
- The median home value was $290,500 in September 2019.
- Maryland home values theoretically increased $49,167 between September 2019 and March 2022.
- The average outstanding mortgage balance in September 2019 was $252,520 or 86.9% of the value a typical home in Maryland.
Massachusetts Home Purchase Returns
Massachusetts’s median home value is far above the average among states, but home values have increased at an average-to-below-average pace over the short- and long-term.
- Homes in Massachusetts rose 2.3% in value between the third and fourth financial quarters in 2021.
- Median home values in Massachusetts increased 14.8% from 2020Q4 to 2021Q4.
- Over five (5) years, Massachusetts home values increased 50.6% or an average quarterly rate of 2.5%.
- From 1991Q1 to 2021Q4, home values increased at a 8.6% quarterly rate.
- The median home value was $408,100 in September 2019.
- Massachusetts home values theoretically increased $103,290 between September 2019 and March 2022.
- The average outstanding mortgage balance in September 2019 was $251,922 or 61.7% of the value a typical home in Massachusetts.
Michigan Home Purchase Returns
Michigan’s median home value is well below the average among states, and home values have increased at an average-to-below-average pace over the short- and long-term.
- Homes in Michigan rose 2.9% in value between the third and fourth financial quarters in 2021.
- Median home values in Michigan increased 15.4% from 2020Q4 to 2021Q4.
- Over five (5) years, Michigan home values increased 56.5% or an average quarterly rate of 2.8%.
- From 1991Q1 to 2021Q4, home values increased at a 6.3% quarterly rate.
- The median home value was $154,500 in September 2019.
- Michigan home values theoretically increased $43,608 between September 2019 and March 2022.
- The average outstanding mortgage balance in September 2019 was $132,467 or 85.7% of the value a typical home in Michigan.
Minnesota Home Purchase Returns
Minnesota’s median home value is on par with the average among states and steady in the long-term, but home values have been slow to appreciate in the short-term.
- Homes in Minnesota rose 2.2% in value between the third and fourth financial quarters in 2021.
- Median home values in Minnesota increased 12.8% from 2020Q4 to 2021Q4.
- Over five (5) years, Minnesota home values increased 46.5% or an average quarterly rate of 2.3%.
- From 1991Q1 to 2021Q4, home values increased at a 8.3% quarterly rate.
- The median home value was $239,900 in September 2019.
- Minnesota home values theoretically increased $55,813 between September 2019 and March 2022.
- The average outstanding mortgage balance in September 2019 was $175,374 or 73.1% of the value a typical home in Minnesota.
Mississippi Home Purchase Returns
Mississippi’s median home value is among the lowest in the nation, and home values have been very slow to increase over the long-term.
- Homes in Mississippi rose 5.3% in value between the third and fourth financial quarters in 2021.
- Median home values in Mississippi increased 17.5% from 2020Q4 to 2021Q4.
- Over five (5) years, Mississippi home values increased 38.8% or an average quarterly rate of 1.9%.
- From 1991Q1 to 2021Q4, home values increased at a 5.2% quarterly rate.
- The median home value was $130,200 in September 2019.
- Mississippi home values theoretically increased $25,259 between September 2019 and March 2022.
- The average outstanding mortgage balance in September 2019 was $122,107 or 93.8% of the value a typical home in Mississippi.
Missouri Home Purchase Returns
Missouri’s median home value is well below the average among states, and home values have been slow to appreciate over the short- and long-term.
- Homes in Missouri rose 2.6% in value between the third and fourth financial quarters in 2021.
- Median home values in Missouri increased 14.9% from 2020Q4 to 2021Q4.
- Over five (5) years, Missouri home values increased 50.9% or an average quarterly rate of 2.5%.
- From 1991Q1 to 2021Q4, home values increased at a 6.7% quarterly rate.
- The median home value was $163,700 in September 2019.
- Missouri home values theoretically increased $41,686 between September 2019 and March 2022.
- The average outstanding mortgage balance in September 2019 was $139,545 or 85.2% of the value a typical home in Missouri.
Montana Home Purchase Returns
Montana’s median home value is on par with the average among states, and home values have appreciated rapidly over the short- and long-term.
- Homes in Montana rose 4.3% in value between the third and fourth financial quarters in 2021.
- Median home values in Montana increased 23.8% from 2020Q4 to 2021Q4.
- Over five (5) years, Montana home values increased 66.5% or an average quarterly rate of 3.3%.
- From 1991Q1 to 2021Q4, home values increased at a 15.1% quarterly rate.
- The median home value was $242,100 in September 2019.
- Montana home values theoretically increased $80,498 between September 2019 and March 2022.
- The average outstanding mortgage balance in September 2019 was $180,711 or 74.6% of the value a typical home in Montana.
Nebraska Home Purchase Returns
Nebraska’s median home value is well below the average among states, and home values have appreciated at an average pace over the short- and long-term.
- Homes in Nebraska rose 2.5% in value between the third and fourth financial quarters in 2021.
- Median home values in Nebraska increased 14.5% from 2020Q4 to 2021Q4.
- Over five (5) years, Nebraska home values increased 51.8% or an average quarterly rate of 2.6%.
- From 1991Q1 to 2021Q4, home values increased at a 7.6% quarterly rate.
- The median home value was $169,900 in September 2019.
- Nebraska home values theoretically increased $44,004 between September 2019 and March 2022.
- The average outstanding mortgage balance in September 2019 was $139,719 or 82.2% of the value a typical home in Nebraska.
Nevada Home Purchase Returns
Nevada’s median home value is well above the average among states, and home values have appreciated significantly over the short-term with average gains in the long-term.
- Homes in Nevada rose 3.4% in value between the third and fourth financial quarters in 2021.
- Median home values in Nevada increased 23.0% from 2020Q4 to 2021Q4.
- Over five (5) years, Nevada home values increased 75.7% or an average quarterly rate of 3.8%.
- From 1991Q1 to 2021Q4, home values increased at a 8.3% quarterly rate.
- The median home value was $291,800 in September 2019.
- Nevada home values theoretically increased $110,461 between September 2019 and March 2022.
- The average outstanding mortgage balance in September 2019 was $226,812 or 77.7% of the value a typical home in Nevada.
New Hampshire Home Purchase Returns
New Hampshire’s median home value is well above the average among states, and home values have increased at an average rate over the short- and long-term.
- Homes in New Hampshire rose 3.1% in value between the third and fourth financial quarters in 2021.
- Median home values in New Hampshire increased 18.5% from 2020Q4 to 2021Q4.
- Over five (5) years, New Hampshire home values increased 63.0% or an average quarterly rate of 3.1%.
- From 1991Q1 to 2021Q4, home values increased at a 7.9% quarterly rate.
- The median home value was $280,400 in September 2019.
- New Hampshire home values theoretically increased $88,312 between September 2019 and March 2022.
- The average outstanding mortgage balance in September 2019 was $179,054 or 63.9% of the value a typical home in New Hampshire.
New Jersey Home Purchase Returns
New Jersey’s median home value is far above the average among states, but the appreciation rate has been below average over the long-term.
- Homes in New Jersey rose 3.2% in value between the third and fourth financial quarters in 2021.
- Median home values in New Jersey increased 15.4% from 2020Q4 to 2021Q4.
- Over five (5) years, New Jersey home values increased 45.1% or an average quarterly rate of 2.3%.
- From 1991Q1 to 2021Q4, home values increased at a 6.6% quarterly rate.
- The median home value was $329,000 in September 2019.
- New Jersey home values theoretically increased $74,255 between September 2019 and March 2022.
- The average outstanding mortgage balance in September 2019 was $239,289 or 72.7% of the value a typical home in New Jersey.
New Mexico Home Purchase Returns
New Mexico’s median home value is well below the average among states, and home values have appreciated at a relatively average pace over the short- and long-term.
- Homes in New Mexico rose 3.2% in value between the third and fourth financial quarters in 2021.
- Median home values in New Mexico increased 15.7% from 2020Q4 to 2021Q4.
- Over five (5) years, New Mexico home values increased 48.5% or an average quarterly rate of 2.4%.
- From 1991Q1 to 2021Q4, home values increased at a 7.0% quarterly rate.
- The median home value was $197,400 in September 2019.
- New Mexico home values theoretically increased $47,840 between September 2019 and March 2022.
- The average outstanding mortgage balance in September 2019 was $161,271 or 81.7% of the value a typical home in New Mexico.
New York Home Purchase Returns
New York’s median home value is well above the average among states, and home values have been relatively slow to increase over the short- and long-term.
- Homes in New York rose 2.1% in value between the third and fourth financial quarters in 2021.
- Median home values in New York increased 13.4% from 2020Q4 to 2021Q4.
- Over five (5) years, New York home values increased 45.9% or an average quarterly rate of 2.3%.
- From 1991Q1 to 2021Q4, home values increased at a 6.7% quarterly rate.
- The median home value was $305,300 in September 2019.
- New York home values theoretically increased $70,051 between September 2019 and March 2022.
- The average outstanding mortgage balance in September 2019 was $237,610 or 77.8% of the value a typical home in New York.
North Carolina Home Purchase Returns
North Carolina’s median home value is well below the average among states; home values have appreciated significantly over the short-term with average gains over the long-term.
- Homes in North Carolina rose 4.0% in value between the third and fourth financial quarters in 2021.
- Median home values in North Carolina increased 21.1% from 2020Q4 to 2021Q4.
- Over five (5) years, North Carolina home values increased 64.0% or an average quarterly rate of 3.2%.
- From 1991Q1 to 2021Q4, home values increased at a 7.5% quarterly rate.
- The median home value was $189,900 in September 2019.
- North Carolina home values theoretically increased $60,730 between September 2019 and March 2022.
- The average outstanding mortgage balance in September 2019 was $162,520 or 85.6% of the value a typical home in North Carolina.
North Dakota Home Purchase Returns
North Dakota’s median home value is well below the average among states; home values have been slow to appreciate over the short-term with average gains over the long term.
- Homes in North Dakota rose 2.3% in value between the third and fourth financial quarters in 2021.
- Median home values in North Dakota increased 10.3% from 2020Q4 to 2021Q4.
- Over five (5) years, North Dakota home values increased 23.5% or an average quarterly rate of 1.2%.
- From 1991Q1 to 2021Q4, home values increased at a 8.3% quarterly rate.
- The median home value was $210,000 in September 2019.
- North Dakota home values theoretically increased $24,644 between September 2019 and March 2022.
- The average outstanding mortgage balance in September 2019 was $162,774 or 77.5% of the value a typical home in North Dakota.
Ohio Home Purchase Returns
Ohio’s median home value is far below the average among states, and home values have appreciated at an average-to-below-average rate over the short- and long-term.
- Homes in Ohio rose 2.6% in value between the third and fourth financial quarters in 2021.
- Median home values in Ohio increased 13.5% from 2020Q4 to 2021Q4.
- Over five (5) years, Ohio home values increased 53.0% or an average quarterly rate of 2.6%.
- From 1991Q1 to 2021Q4, home values increased at a 5.3% quarterly rate.
- The median home value was $142,600 in September 2019.
- Ohio home values theoretically increased $37,768 between September 2019 and March 2022.
- The average outstanding mortgage balance in September 2019 was $122,939 or 86.2% of the value a typical home in Ohio.
Oklahoma Home Purchase Returns
Oklahoma’s median home value is far below the average among states; home values have appreciated slowly over the long-term, but short-term gains have been significant.
- Homes in Oklahoma rose 3.6% in value between the third and fourth financial quarters in 2021.
- Median home values in Oklahoma increased 16.6% from 2020Q4 to 2021Q4.
- Over five (5) years, Oklahoma home values increased 44.3% or an average quarterly rate of 2.2%.
- From 1991Q1 to 2021Q4, home values increased at a 6.7% quarterly rate.
- The median home value was $125,400 in September 2019.
- Oklahoma home values theoretically increased $27,795 between September 2019 and March 2022.
- The average outstanding mortgage balance in September 2019 was $134,811 or 107.5% of the value a typical home in Oklahoma.
Oregon Home Purchase Returns
Oregon’s median home value is far above the average among states, and home values have increased tremendously over the long-term.
- Homes in Oregon rose 2.7% in value between the third and fourth financial quarters in 2021.
- Median home values in Oregon increased 18.1% from 2020Q4 to 2021Q4.
- Over five (5) years, Oregon home values increased 57.4% or an average quarterly rate of 2.9%.
- From 1991Q1 to 2021Q4, home values increased at a 14.8% quarterly rate.
- The median home value was $350,600 in September 2019.
- Oregon home values theoretically increased $100,622 between September 2019 and March 2022.
- The average outstanding mortgage balance in September 2019 was $225,597 or 64.3% of the value a typical home in Oregon.
Pennsylvania Home Purchase Returns
Pennsylvania’s median home value is well below the average among states, and home values have been slow to appreciate over the short- and long-term.
- Homes in Pennsylvania rose 2.6% in value between the third and fourth financial quarters in 2021.
- Median home values in Pennsylvania increased 13.3% from 2020Q4 to 2021Q4.
- Over five (5) years, Pennsylvania home values increased 45.4% or an average quarterly rate of 2.3%.
- From 1991Q1 to 2021Q4, home values increased at a 6.0% quarterly rate.
- The median home value was $176,500 in September 2019.
- Pennsylvania home values theoretically increased $40,039 between September 2019 and March 2022.
- The average outstanding mortgage balance in September 2019 was $145,358 or 82.4% of the value a typical home in Pennsylvania.
Rhode Island Home Purchase Returns
Rhode Island’s median home value is above the average among states, and home values have increased at an average-to-below-average rate over the short- and long-term.
- Homes in Rhode Island rose 2.5% in value between the third and fourth financial quarters in 2021.
- Median home values in Rhode Island increased 16.9% from 2020Q4 to 2021Q4.
- Over five (5) years, Rhode Island home values increased 59.7% or an average quarterly rate of 3.0%.
- From 1991Q1 to 2021Q4, home values increased at a 6.9% quarterly rate.
- The median home value was $284,200 in September 2019.
- Rhode Island home values theoretically increased $84,819 between September 2019 and March 2022.
- The average outstanding mortgage balance in September 2019 was $185,777 or 65.4% of the value a typical home in Rhode Island.
South Carolina Home Purchase Returns
South Carolina’s median home value is well below the average among states, and home values have increased significantly in the last few years.
- Homes in South Carolina rose 5.5% in value between the third and fourth financial quarters in 2021.
- Median home values in South Carolina increased 21.4% from 2020Q4 to 2021Q4.
- Over five (5) years, South Carolina home values increased 60.4% or an average quarterly rate of 3.0%.
- From 1991Q1 to 2021Q4, home values increased at a 7.4% quarterly rate.
- The median home value was $170,700 in September 2019.
- South Carolina home values theoretically increased $51,577 between September 2019 and March 2022.
- The average outstanding mortgage balance in September 2019 was $160,059 or 93.8% of the value a typical home in South Carolina.
South Dakota Home Purchase Returns
South Dakota’s median home value is below the average among states, and home values have increased significantly over the short- and long-term.
- Homes in South Dakota rose 4.2% in value between the third and fourth financial quarters in 2021.
- Median home values in South Dakota increased 20.1% from 2020Q4 to 2021Q4.
- Over five (5) years, South Dakota home values increased 52.8% or an average quarterly rate of 2.6%.
- From 1991Q1 to 2021Q4, home values increased at a 9.4% quarterly rate.
- The median home value was $194,700 in September 2019.
- home values theoretically increased $51,352 between September 2019 and March 2022.
- The average outstanding mortgage balance in September 2019 was $151,489 or 77.8% of the value a typical home in South Dakota.
Tennessee Home Purchase Returns
Tennessee’s median home value is well below the average among states, and home values have appreciated significantly over the short- and long-term.
- Homes in Tennessee rose 5.4% in value between the third and fourth financial quarters in 2021.
- Median home values in Tennessee increased 24.1% from 2020Q4 to 2021Q4.
- Over five (5) years, Tennessee home values increased 71.4% or an average quarterly rate of 3.6%.
- From 1991Q1 to 2021Q4, home values increased at a 8.8% quarterly rate.
- The median home value was $170,800 in September 2019.
- Tennessee home values theoretically increased $60,959 between September 2019 and March 2022.
- The average outstanding mortgage balance in September 2019 was $157,080 or 92.0% of the value a typical home in Tennessee.
Texas Home Purchase Returns
Texas’s median home value is below the average among states, and home values have increased at an above-average rate over the short- and long-term.
- Homes in Texas rose 3.8% in value between the third and fourth financial quarters in 2021.
- Median home values in Texas increased 19.3% from 2020Q4 to 2021Q4.
- Over five (5) years, Texas home values increased 54.0% or an average quarterly rate of 2.7%.
- From 1991Q1 to 2021Q4, home values increased at a 8.8% quarterly rate.
- The median home value was $199,900 in September 2019.
- Texas home values theoretically increased $53,993 between September 2019 and March 2022.
- The average outstanding mortgage balance in September 2019 was $177,924 or 89.0% of the value a typical home in Texas.
Utah Home Purchase Returns
Utah’s median home value is far above the average among states, and the appreciation rate is consistently high over the short- and long-term.
- Homes in Utah rose 3.9% in value between the third and fourth financial quarters in 2021.
- Median home values in Utah increased 27.1% from 2020Q4 to 2021Q4.
- Over five (5) years, Utah home values increased 91.0% or an average quarterly rate of 4.6%.
- From 1991Q1 to 2021Q4, home values increased at a 16.9% quarterly rate.
- The median home value was $351,100 in September 2019.
- Utah home values theoretically increased $159,803 between September 2019 and March 2022.
- The average outstanding mortgage balance in September 2019 was $216,213 or 61.9% of the value a typical home in Utah.
Vermont Home Purchase Returns
Vermont’s median home value is below the average among states, and appreciation has remained at a relatively average rate over the short- and long-term.
- Homes in Vermont rose 3.0% in value between the third and fourth financial quarters in 2021.
- Median home values in Vermont increased 20.0% from 2020Q4 to 2021Q4.
- Over five (5) years, Vermont home values increased 53.0% or an average quarterly rate of 2.7%.
- From 1991Q1 to 2021Q4, home values increased at a 7.0% quarterly rate.
- The median home value was $210,600 in September 2019.
- Vermont home values theoretically increased $55,830 between September 2019 and March 2022.
- The average outstanding mortgage balance in September 2019 was $147,241 or 69.9% of the value a typical home in Vermont.
Virginia Home Purchase Returns
Virginia’s median home value is slightly higher than the average among states, and home values have been slow to appreciate over the short- and long-term.
- Homes in Virginia rose 2.2% in value between the third and fourth financial quarters in 2021.
- Median home values in Virginia increased 13.4% from 2020Q4 to 2021Q4.
- Over five (5) years, Virginia home values increased 44.0% or an average quarterly rate of 2.2%.
- From 1991Q1 to 2021Q4, home values increased at a 7.2% quarterly rate.
- The median home value was $264,200 in September 2019.
- Virginia home values theoretically increased $58,058 between September 2019 and March 2022.
- The average outstanding mortgage balance in September 2019 was $242,397 or 91.7% of the value a typical home in Virginia.
Washington Home Purchase Returns
Washington’s median home value is among the highest in the nation, and appreciation rates have been consistently high over the short- and long-term.
- Homes in Washington rose 3.9% in value between the third and fourth financial quarters in 2021.
- Median home values in Washington increased 20.1% from 2020Q4 to 2021Q4.
- Over five (5) years, Washington home values increased 77.0% or an average quarterly rate of 3.9%.
- From 1991Q1 to 2021Q4, home values increased at a 13.2% quarterly rate.
- The median home value was $393,800 in September 2019.
- Washington home values theoretically increased $151,692 between September 2019 and March 2022.
- The average outstanding mortgage balance in September 2019 was $263,681 or 67.0% of the value a typical home in Washington.
West Virginia Home Purchase Returns
West Virginia’s median home value is the lowest among states, and home values have been very slow to appreciate over the short- and long-term.
- Homes in West Virginia rose 1.8% in value between the third and fourth financial quarters in 2021.
- Median home values in West Virginia increased 12.0% from 2020Q4 to 2021Q4.
- Over five (5) years, West Virginia home values increased 28.5% or an average quarterly rate of 1.4%.
- From 1991Q1 to 2021Q4, home values increased at a 5.1% quarterly rate.
- The median home value was $99,000 in September 2019.
- West Virginia home values theoretically increased $14,112 between September 2019 and March 2022.
- The average outstanding mortgage balance in September 2019 was $110,464 or 111.6% of the value a typical home in West Virginia.
Wisconsin Home Purchase Returns
Wisconsin’s median home value is well below the average among states, and home values have increased at an average-to-below-average rate over the short- and long-term.
- Homes in Wisconsin rose 2.4% in value between the third and fourth financial quarters in 2021.
- Median home values in Wisconsin increased 13.5% from 2020Q4 to 2021Q4.
- Over five (5) years, Wisconsin home values increased 51.1% or an average quarterly rate of 2.6%.
- From 1991Q1 to 2021Q4, home values increased at a 7.5% quarterly rate.
- The median home value was $191,600 in September 2019.
- Wisconsin home values theoretically increased $48,963 between September 2019 and March 2022.
- The average outstanding mortgage balance in September 2019 was $138,789 or 72.4% of the value a typical home in Wisconsin.
Wyoming Home Purchase Returns
Wyoming’s median home value is on par with the average among states, and home values have typically appreciated at an average-to-above-average pace over the short- and long-term.
- Homes in Wyoming rose 4.1% in value between the third and fourth financial quarters in 2021.
- Median home values in Wyoming increased 15.8% from 2020Q4 to 2021Q4.
- Over five (5) years, Wyoming home values increased 42.2% or an average quarterly rate of 2.1%.
- From 1991Q1 to 2021Q4, home values increased at a 10.7% quarterly rate.
- The median home value was $236,100 in September 2019.
- Wyoming home values theoretically increased $49,817 between September 2019 and March 2022.
- The average outstanding mortgage balance in September 2019 was $185,414 or 78.5% of the value a typical home in Wyoming.
House Flipping Returns
The house flipping isn’t as lucrative now as it was several years ago, but certain markets are still very active. High returns depend on careful planning and focus on the best home improvements for resale.
- 38.7% is the national average ROI for a flipped house.
- Nationwide, flipping a house averages a $121,325 ROI.
- Market volatility makes predicting ROI on a particular building difficult if not impossible.
- Statistical trends indicate that rental rates are increasing as homeownership falls out of favor in certain regions.
Metro2019 ROINet Profit*
| Pittsburgh, PA | 131.2% | $159,920 |
| Flint, Michigan | 127.6% | $117,730 |
| Shreveport, Louisiana | 112.5% | $219,490 |
| Scranton, Pennsylvania | 112.0% | $126,790 |
| Knoxville, Tennessee | 105.0% | $250,640 |
| Cleveland, Ohio | 100.0% | $187,900 |
| Philadelphia, Pennsylvania | 100.0% | $286,800 |
| Buffalo, New York | 89.7% | $171,150 |
| Memphis, Tennessee | 79.2% | $184,460 |
Commercial Real Estate
Some investors consider commercial real estate to be the more cost effective investment due to the greater potential for large returns. Commercial property values, however, are relatively inconsistent.
- The 1-year ROI on an average 20,000 square foot commercial property is -$32,000.
- Commercial real estate acquisitions fell by as much as 57% in 2020.
- Industrial real estate is the only commercial property type experiencing 12-month gains.
- Apartment rentals may fall under commercial real estate or flex space if the building also includes commercial rentals (i.e. offices, retail shops, etc.)
- Apartments designated commercial real estate is suffering heavy financial losses compared to smaller buildings and residential complexes.
- Economics experts expect commercial real estate values to climb in 2021.
Property Type1-Year ROI1-Year Net
| Industrial Property | 9.5% | $8.16/ft2 |
| Office Space | -0.2% | -$0.33/ft2 |
| Retail Space | -6.7% | -$14.79/ft2 |
| Small Motel | -7.2% | -$16.79/ft2 |
| Large Hotel | -7.2% | -$36.94/ft2 |
| Average Commercial Property | -8.0% | -$1.60/ft2 |
| Upscale Retail/Boutique | -9.0% | -$19.89 |
Real Estate Market Investment
Real estate indices suggest that real estate investments suffered through 2020, with consequences unevenly distributed throughout the industry.
- The Dow Jones U.S. Real Estate Index indicates the average 1-year return on real estate is -11.13%.
- A 3-year return is 2.34%, and a 5-year return is 3.16%.
- The Standard & Poor’s (S&P) 500 Real Estate Index reports the average 1-year return at -7.71%.
- A 3-year return is 4.92%, and a 5-year returns is 4.20%.
- S&P’s U.S. Real Estate Investment Trust (REIT) has a 1-year ROI of -12.32%.
- REITs for data centers have the highest returns at 17.2%.

Real Estate Trusts & Funds
REITs may be attractive to new investors who want to learn how to start investing in real estate, especially those who already have experience with stock market investments.
- REITs are required to return 90% of taxable income to shareholders in order to receive special tax considerations.
- Established through the Cigar Excise Tax Extension of 1960, REITs became commonplace in the 1980s and ’90s.
- One study found that REITs delivered the highest 30-year return on investment compared to other types of real estate investments.
- Equity REITs outearned apartment building investments by 102.2%, and they outearned hotel investments 231.7%.
Fund Symbol, Full NameYTD1-Year ROI
| XLRE, Real Estate Select Sector SPDR Fund | -4.92% | 45.59% |
| FREL, Fidelity MSCI Real Estate Index ETF | -7.14% | 43.94% |
| EWRE, Invesco S&P 500® Equal Weight Real Estate ETF | -4.11% | 32.58% |
| VNQ, Vanguard Real Estate Index Fund | -7.14% | 35.50% |
| IYR, iShares U.S. Real Estate ETF | -8.38% | 41.29% |
| PSR, Invesco Active U.S. Real Estate Fund | -8.57% | 40.53% |
Historical Real Estate Investment Returns
While real estate has historically been considered the best investment, the market can also be volatile.
- 1-year real estate investment returns hit their highest point in 1946, with that year’s S&P hitting 24.10%.
- In 2008, the average 1-year return fell to -12.00%, its lowest point prior to 2020.
- Prior to the 2020 crash, the average annual return in the 21st Century was 4.12%.
- Also prior to the 2020 crash, the average 10-year ROI was 39.54%; the average 20-year ROI was 82.49%.

Sources
- Federal Reserve Economic Data, S&P/Case-Shiller U.S. National Home Price Index
- S&P Dow Jones Indices, Dow Jones U.S. Real Estate Index
- National Apartment Association, NAA 2021 Survey of Operating Income & Expenses in Rental Apartment Communities
- National Bureau of Economic Research, Total Returns to Single Family Rentals
- University of New Hampshire, U.S. Real Estate Investment Performance: 1983-2012
- National Association of Realtors® (NAR), Research and Statistics: Housing Statistics
- NAR, Commercial Market Insights December 2020
- National Association for Industrial and Office Parks, Office Space Demand Forecast, Fourth Quarter 2020
- Attom Data Solutions, U.S. Home Flipping Rate Reaches a Nine-Year High in Q1 2019
- Zillow, United States Housing Data
- Fixr, How Much Does It Cost to Build the Average Hotel?
- PEW Research Center, Prompted by Pandemic, Some States Buy Hotels for the Homeless
- National Apartment Association, 2019 NAA Survey of Operating Income & Expenses in Rental Apartment Communities
- Urban Land Institute, Emerging Trends in Real Estate®: United States & Canada 2021
- American Association of Retired Persons, Vacation Home Rentals Billed as Safer Alternatives to Hotels
- Phocus Wire, Touchless Tech: How Short-Term Rentals Are Simplifying Stays Amid COVID-19
- National Association of Home Builders (NAHB), Apartment Absorption Steady but Rent Prices Fall
- Realtor.com, Real Estate Data Library
- Quartz, Hotels Are Shrinking Rooms and Adding More Places to be Alone with Other People
- NAHB, New Single Family Home Size Continues to Fall
- Public Library of Science, 120 Years of U.S. Residential Housing Stock and Floor Space
- HospitalityNet, The Growth of Microhotels in North America
- The Journal of Real Estate Finance and Economics, Why Are Small and Medium Multifamily Properties So Inexpensive?
- ETF Database, Real Estate ETFs