Highlights. New house starts in 2024 are 0.66% higher than the previous 120-month average.
- 74.6% of new house starts are single family homes; most new house starts (55.0%) are in the southern region.
- In 2023, there were 1.420 million nonseasonally adjusted new house starts; seasonally adjusted housing starts totaled 1.568 million.*
- House starts in 2023 were down 8.55% year-over-year (YoY) and the ratio of new house starts to permits issued was 95.0%
- 66.7% of new house starts were single family homes, up 3.08% YoY.
- Single-family home builds were down 19.6% from 2005 (as a share of all house starts).
*All data are not adjusted unless otherwise noted. Nonadjusted statistics represent true data; seasonal adjustment compensates for annual peaks and valleys in the real estate construction market and more accurately reflects market health.

| Month | Permits | Starts |
|---|---|---|
| Oct ’24 | 124,800 | 111,500 |
| Sep ’24’ | 113,500 | 115,900 |
| Aug ’24 | 131,900 | 120,800 |
| Jul ’24 | 126,500 | 115,300 |
| Jun ’24 | 125,700 | 123,600 |
| May ’24 | 132,400 | 120,900 |
| Apr ’24 | 132,300 | 125,700 |
| Mar ’24 | 124,300 | 109,800 |
| Feb ’24 | 119,100 | 113,700 |
| Jan ’24 | 114,800 | 97,900 |
| Dec ’23 | 104,800 | 108,900 |
| Nov ’23 | 112,600 | 116,500 |
| Oct ’23 | 129,200 | 115,100 |

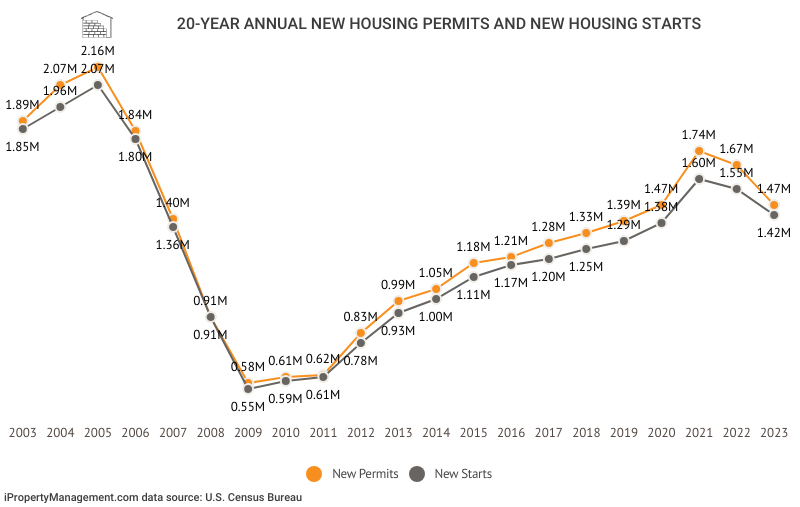
New Housing Starts by Year
New house starts or new housing starts refer to residential construction projects that have broken ground. Most of the data in this report has not been seasonally adjusted.
- Over 5 years (2019 through 2023), an average of 1,448,620 new privately owned housing units broke ground annually.
- 1.55 million is the 5-year annual average number of housing permits authorized.
- In 2023, there were 1.420 million new house starts, down 8.55% from 2022.
- 1.494 million total housing permits were issued in 2023, down 10.3% from 2022.
- An average of 1.397 million housing units have been completed each year starting in 2014.
- 1.433 million is the average annual number of homes started since 1959.
- New starts in 2023 were up 156.3% compared to 2009, the industry’s lowest point since 1959.
- The most dramatic annual decrease in housing starts was in 2009, when new builds fell 35.6% from the previous year.
- 2008 itself was the second-most dramatic plunge with new house starts down 35.3% from 2007.

| Year | Permits | Starts |
|---|---|---|
| 2023 | 1,493,900 | 1,419,900 |
| 2022 | 1,665,100 | 1,552,600 |
| 2021 | 1,737,000 | 1,601,000 |
| 2020 | 1,471,100 | 1,379,600 |
| 2019 | 1,386,000 | 1,290,000 |
| 2018 | 1,328,800 | 1,249,900 |
| 2017 | 1,282,000 | 1,203,000 |
| 2016 | 1,206,600 | 1,173,800 |
| 2015 | 1,182,600 | 1,111,800 |
| 2014 | 1,052,100 | 1,003,300 |
| 2013 | 990,800 | 924,900 |
| 2012 | 829,700 | 780,600 |
| 2011 | 624,100 | 608,800 |
| 2010 | 604,600 | 586,900 |
| 2009 | 583,000 | 554,000 |
| 2008 | 905,400 | 905,500 |
| 2007 | 1,398,400 | 1,355,000 |
| 2006 | 1,838,900 | 1,800,900 |
| 2005 | 2,155,300 | 2,068,300 |
| 2004 | 2,070,100 | 1,955,800 |
| 2003 | 1,889,200 | 1,847,700 |
| 2002 | 1,747,700 | 1,704,900 |
| 2001 | 1,636,700 | 1,602,700 |
| 2000 | 1,592,300 | 1,568,700 |
New Housing Starts in 2022
Statistics indicate that 2022 was a relatively typical year for construction compared to 2020 and 2021.
- There were 1.553 million new house starts in 2022, down 3.02% YoY.
- 1.67 million new housing permits represented a 4.14% decline from 2021.
- 64.7% of new house starts were single family housing, down 8.10% YoY.
- The ratio of new house starts to housing permits was 93.2%.
- The busiest month (April) saw 32.8% more house starts than the slowest month (July).
- In seasonally adjusted statistics, the busiest month (April) had a 32.9% higher annual monthly average than the slowest time of year (December).
- The annual monthly average among seasonally adjusted measurements was 129,271 new house starts, down 3.35% from 2021.
- Among non-adjusted data, the monthly average number of housing starts was 129,383; this is 0.09% higher than the seasonally adjusted monthly average.

New Housing Starts in 2021
2021 saw the most new privately owned residential construction starts since 2006.
- 1.60 million total new privately owned housing starts began in 2021, down 12.8% from 2020.
- 1.74 million total housing permits were issued in 2021, up 18.1% from 2020.
- 28.9% of housing starts in 2021 were buildings of 5-or-more units.
- 70.4% of new housing was single family homes.
- The busiest month (June) saw 51.1% more house starts than the slowest month (February).
- In seasonally adjusted statistics, the busiest month (December) had a 23.5% higher annual monthly average than the slowest time of year (February).
- The annual monthly average among seasonally adjusted measurements was 133,750 new house starts.
- Among non-adjusted data, the monthly average number of housing starts was 121,758; this is 8.97% lower than the seasonally adjusted monthly average.

Historical Housing Starts
Some public statistics for building starts and permits date to the 1950s.
- New privately owned housing starts average 119,414 monthly.
- An average of 113,995 new housing permits are authorized monthly.
- Housing units are completed at an average rate of 116,410 per month.
| Year | Permits | Starts |
|---|---|---|
| 1999 | 1,663,500 | 1,640,900 |
| 1995 | 1,332,500 | 1,354,100 |
| 1990 | 1,110,800 | 1,192,700 |
| 1985 | 1,733,300 | 1,741,800 |
| 1980 | 1,190,600 | 1,292,200 |
| 1975 | 939,200 | 1,160,400 |
| 1970 | 1,351,500 | 1,433,600 |
| 1965 | 1,240,600 | 1,472,800 |
| 1960 | 997,600 | 1,252,200 |
Housing Starts by Location
Among regional housing starts, the South produces the highest rate of single family homes.
- In 2023, 55.8% of all housing starts were in the South.
- The number of housing starts in the South was down 5.04% YoY.
- 71.2% of Southern housing starts were single family.
- 8.09% of new housing starts in 2023 were in the Northeast.
- The number of housing starts in the Northeast was down 19.2% YoY.
- 53.0% of Northeastern homes were single family, giving it the lowest rate of single family home builds.
- 13.0% of all housing starts were in the Midwest in 2023.
- The number of housing starts in the Midwest was down 10.2% YoY.
- 63.8% of Midwestern new housing starts were single family homes.
- 23.1% of all new housing starts are in the West.
- The number of housing starts in the West declined 11.4% from 2022 to 2023.
- 62.4% of new Western homes are single family.
| Region | Total Starts | Single Family |
|---|---|---|
| Northeast | 114,800 | 60,800 |
| Midwest | 184,900 | 118,000 |
| South | 792,100 | 564,200 |
| West | 328,200 | 204,700 |
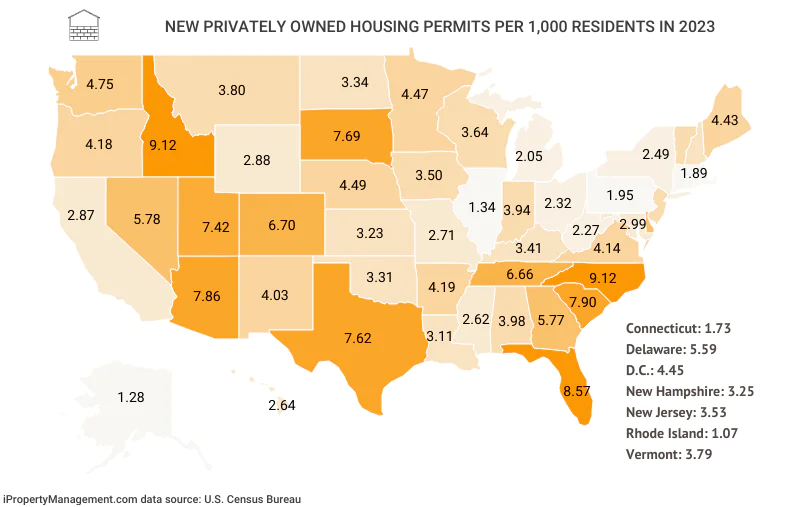
Housing Permits by State
Statistics indicate that most states and territories have steady real estate and construction industries. While data on housing starts is unavailable, build authorizations are useful for comparative purposes.
- New single family homes in Hawaii cost more to build (average value $487,974 in 2023) than homes in any other state.
- The nation’s least expensive single family home builds in 2023 were in Delaware (average value $150,645).
- North Carolina saw the largest number of new build permits relative to the population with one (1) new unit for every 109.61 residents in 2023.
- Rhode Island had the lowest number of new build permits relative to the population with one (1) new unit for every 938 residents.
| State | Building Permits | Units Authorized |
|---|---|---|
| Alabama | 16,618 | 20,337 |
| Alaska | 640 | 937 |
| Arizona | 36,264 | 58,433 |
| Arkansas | 10,123 | 12,842 |
| California | 62,215 | 111,760 |
| Colorado | 20,665 | 39,404 |
| Connecticut | 2,301 | 6,272 |
| D.C. | 242 | 3,020 |
| Delaware | 4,770 | 5,765 |
| Florida | 129,555 | 193,788 |
| Georgia | 45,559 | 63,621 |
| Hawaii | 2,499 | 3,791 |
| Idaho | 12,548 | 17,919 |
| Illinois | 10,373 | 16,863 |
| Indiana | 17,707 | 27,055 |
| Iowa | 7,833 | 11,230 |
| Kansas | 5,855 | 9,504 |
| Kentucky | 8,603 | 15,415 |
| Louisiana | 11,653 | 14,247 |
| Maine | 4,783 | 6,183 |
| Maryland | 10,665 | 18,453 |
| Massachusetts | 5,696 | 13,214 |
| Michigan | 15,123 | 20,592 |
| Minnesota | 13,236 | 25,667 |
| Mississippi | 7,253 | 7,700 |
| Missouri | 11,690 | 16,781 |
| Montana | 2,469 | 4,307 |
| Nebraska | 4,989 | 8,877 |
| Nevada | 13,430 | 18,451 |
| New Hampshire | 3,157 | 4,555 |
| New Jersey | 15,129 | 32,840 |
| New Mexico | 6,951 | 8,511 |
| New York | 11,230 | 48,807 |
| North Carolina | 67,187 | 98,853 |
| North Dakota | 1,573 | 2,618 |
| Ohio | 17,032 | 27,318 |
| Oklahoma | 10,910 | 13,405 |
| Oregon | 10,419 | 17,697 |
| Pennsylvania | 16,582 | 25,320 |
| Puerto Rico | ||
| Rhode Island | 789 | 1,169 |
| South Carolina | 37,988 | 42,474 |
| South Dakota | 3,562 | 7,072 |
| Tennessee | 32,242 | 47,463 |
| Texas | 155,602 | 232,373 |
| Utah | 15,631 | 25,361 |
| Vermont | 1,440 | 2,456 |
| Virgin Islands | 277 | 354 |
| Virginia | 21,878 | 36,096 |
| Washington | 19,522 | 37,097 |
| West Virginia | 3,339 | 4,014 |
| Wisconsin | 12,569 | 21,494 |
| Wyoming | 1,497 | 1,681 |
Alabama Housing & Build Permits
New housing authorizations in Alabama represented 1.35% of nationwide permits issued in 2023; single-family home construction costs per unit were lower than the national average, and costs were higher than average for units in shared buildings.
- 20,337 new housing units were authorized in Alabama in 2023.
- 16,298 or 80.1% of units were single family homes.
- The average permit for buildings included 1.2 housing units each.
- Buildings with five (5) units or more averaged 24.3 units per building.
- 98.1% of buildings authorized in Alabama were single family homes.
- 0.9% of buildings authorized had 5+ units; 17.9% of all units authorized were in these buildings.
- The valuation for the average single family home build in Alabama was $273,654 (up 5.13% YoY).
- In buildings with 5+ units, the valuation per unit was $153,903 (down 3.03%).
- New residential build permits in Alabama had a total valuation of $5.08 billion in 2023, up 8.06% YoY.
Alaska Housing & Build Permits
New housing authorizations in Alaska represented 0.06% of nationwide permits issued in 2023; single-family home construction costs per unit were higher than the national average, and costs were lower than average for units in shared buildings.
- 937 new housing units were authorized in Alaska in 2023.
- 599 or 63.9% of units were single family homes.
- The average permit for buildings included 1.5 housing units each.
- Buildings with five (5) units or more averaged 21.2 units per building.
- 93.6% of buildings authorized in Alaska were single family homes.
- 2.0% of buildings authorized had 5+ units; 29.3% of all units authorized were in these buildings.
- The valuation for the average single family home build in Alaska was $357,833 (up 0.69% YoY).
- In buildings with 5+ units, the valuation per unit was $127,371 (down 19.8%).
- New residential build permits in Alaska had a total valuation of $262 million in 2023, up 41.9% YoY.
Arizona Housing & Build Permits
New housing authorizations in Arizona represented 3.87% of nationwide permits issued in 2023; construction costs per unit were comparable to the national average.
- 58,433 new housing units were authorized in Arizona in 2023.
- 34,429 or 58.9% of units were single family homes.
- The average permit for buildings included 1.6 housing units each.
- Buildings with five (5) units or more averaged 30.4 units per building.
- 94.9% of buildings authorized in Arizona were single family homes.
- 2.0% of buildings authorized had 5+ units; 37.0% of all units authorized were in these buildings.
- The valuation for the average single family home build in Arizona was $289,276 (up 2.41% YoY).
- In buildings with 5+ units, the valuation per unit was $151,745 (down 8.31%).
- New residential build permits in Arizona had a total valuation of $13.56 billion in 2023, down 6.59% YoY.

Arkansas Housing & Build Permits
New housing authorizations in Arkansas represented 0.85% of nationwide permits issued in 2023; home construction costs per unit were lower than the national average.
- 12,842 new housing units were authorized in Arkansas in 2023.
- 9,360 or 72.9% of units were single family homes.
- The average permit for buildings included 1.3 housing units each.
- Buildings with five (5) units or more averaged 14.5 units per building.
- 92.5% of buildings authorized in Arkansas were single family homes.
- 1.4% of buildings authorized had 5+ units; 16.3% of all units authorized were in these buildings.
- The valuation for the average single family home build in Arkansas was $254,692 (down 5.25% YoY).
- In buildings with 5+ units, the valuation per unit was $123,825 (up 41.7%).
- New residential build permits in Arkansas had a total valuation of $2.84 billion in 2023, down 5.78% YoY.
California Housing & Build Permits
New housing authorizations in California represented 7.39% of nationwide permits issued in 2023; construction costs per unit were a little higher than the national average.
- 111,760 new housing units were authorized in California in 2023.
- 58,534 or 52.4% of units were single family homes.
- The average permit for buildings included 1.8 housing units each.
- Buildings with five (5) units or more averaged 24.3 units per building.
- 94.1% of buildings authorized in California were single family homes.
- 3.3% of buildings authorized had 5+ units; 44.1% of all units authorized were in these buildings.
- The valuation for the average single family home build in California was $306,097 (up 5.17% YoY).
- In buildings with 5+ units, the valuation per unit was $183,207 (up 0.64%).
- New residential build permits in California had a total valuation of $27.9 billion in 2023, down 3.99% YoY.
Colorado Housing & Build Permits
New housing authorizations in Colorado represented 2.61% of nationwide permits issued in 2023; construction costs per unit were higher than the national average.
- 39,404 new housing units were authorized in Colorado in 2023.
- 19,641 or 49.8% of units were single family homes.
- The average permit for buildings included 1.9 housing units each.
- Buildings with five (5) units or more averaged 30.6 units per building.
- 95.0% of buildings authorized in Colorado were single family homes.
- 3.0% of buildings authorized had 5+ units; 47.6% of all units authorized were in these buildings.
- The valuation for the average single family home build in Colorado was $379,767 (up 6.57% YoY).
- In buildings with 5+ units, the valuation per unit was $179,639 (4.95%).
- New residential build permits in Colorado had a total valuation of $11.04 billion in 2023, down 13.5% YoY.
Connecticut Housing & Build Permits
New housing authorizations in Connecticut represented 0.41% of nationwide permits issued in 2023; single-family home construction costs per unit were much higher than the national average while costs were lower than average for units in shared buildings.
- 6,272 new housing units were authorized in Connecticut in 2023.
- 2,050 or 32.7% of units were single family homes.
- The average permit for buildings included 2.7 housing units each.
- Buildings with five (5) units or more averaged 27.2 units per building.
- 89.1% of buildings authorized in Connecticut were single family homes.
- 6.3% of buildings authorized had 5+ units; 62.8% of all units authorized were in these buildings.
- The valuation for the average single family home build in Connecticut was $444,581 (up 8.18% YoY).
- In buildings with 5+ units, the valuation per unit was $128,619 (down 27.1%).
- New residential build permits in Connecticut had a total valuation of $1.467 billion in 2023, down 8.44% YoY.
Delaware Housing & Build Permits
New housing authorizations in Delaware represented 0.38% of nationwide permits issued in 2023; construction costs per unit were much lower than the national average.
- 5,765 new housing units were authorized in Delaware in 2023.
- 4,685 or 81.2% of units were single family homes.
- The average permit for buildings included 1.2 housing units each.
- Buildings with five (5) units or more averaged 30.4 units per building.
- 98.2% of buildings authorized in Delaware were single family homes.
- 0.7% of buildings authorized had 5+ units; 16.9% of all units authorized were in these buildings.
- The valuation for the average single family home build in Delaware was $150,645 (up 2.86% YoY).
- In buildings with 5+ units, the valuation per unit was $107,083 (up 38.2%).
- New residential build permits in Delaware had a total valuation of $828 million in 2023, down 9.33% YoY.
District of Columbia Housing & Build Permits
New housing authorizations in D.C. represented 0.2% of nationwide permits issued in 2023; construction costs per unit were lower than the national average.
- 3,020 new housing units were authorized in D.C. in 2023.
- 166 or 5.50% of units were single family homes.
- The average permit for buildings included 12.5 housing units each.
- Buildings with five (5) units or more averaged 67.8 units per building.
- 68.6% of buildings authorized in D.C. were single family homes.
- 16.9% of buildings authorized had 5+ units; 92.0% of all units authorized were in these buildings.
- The valuation for the average single family home build in D.C. was $276,861 (up 10.2% YoY).
- In buildings with 5+ units, the valuation per unit was $133,561 (up 5.03%).
- New residential build permits in D.C. had a total valuation of $428 million in 2023, down 58.5% YoY.
Florida Housing & Build Permits
New housing authorizations in Florida represented 12.8% of nationwide permits issued in 2023; construction costs per unit were higher than the national average.
- 193,788 new housing units were authorized in Florida in 2023.
- 125,773 or 64.9% of units were single family homes.
- The average permit for buildings included 1.5 housing units each.
- Buildings with five (5) units or more averaged 30.5 units per building.
- 97.1% of buildings authorized in Florida were single family homes.
- 1.6% of buildings authorized had 5+ units; 33.0% of all units authorized were in these buildings.
- The valuation for the average single family home build in Florida was $307,107 (up 1.40% YoY).
- In buildings with 5+ units, the valuation per unit was $179,082 (up 26.3%).
- New residential build permits in Florida had a total valuation of $50.7 billion in 2023, down 1.00% YoY.
Georgia Housing & Build Permits
New housing authorizations in Georgia represented 4.21% of nationwide permits issued in 2023; construction costs per unit were lower than the national average.
- 63,621 new housing units were authorized in Georgia in 2023.
- 44,405 or 69.8% of units were single family homes.
- The average permit for buildings included 1.4 housing units each.
- Buildings with five (5) units or more averaged 25.3 units per building.
- 97.5% of buildings authorized in Georgia were single family homes.
- 1.6% of buildings authorized had 5+ units; 28.3% of all units authorized were in these buildings.
- The valuation for the average single family home build in Georgia was $269,220 (up 4.29% YoY).
- In buildings with 5+ units, the valuation per unit was $140,414 (up 10.6%).
- New residential build permits in Georgia had a total valuation of $14.7 billion in 2023, down 8.49% YoY.
Hawaii Housing & Build Permits
New housing authorizations in Hawaii represented 0.25% of nationwide permits issued in 2023; construction costs per unit were the highest in the nation.
- 3,791 new housing units were authorized in Hawaii in 2023.
- 2,360 or 62.3% of units were single family homes.
- The average permit for buildings included 1.5 housing units each.
- Buildings with five (5) units or more averaged 31.5 units per building.
- 94.4% of buildings authorized in Hawaii were single family homes.
- 1.6% of buildings authorized had 5+ units; 32.4% of all units authorized were in these buildings.
- The valuation for the average single family home build in Hawaii was $487,974 (down 3.46% YoY).
- In buildings with 5+ units, the valuation per unit was $337,858 (down 4.01%).
- New residential build permits in Hawaii had a total valuation of $1.61 billion in 2023, down 10.2% YoY.
Idaho Housing & Build Permits
New housing authorizations in Idaho represented 1.19% of nationwide permits issued in 2023; single-family home construction costs per unit were lower than the national average, and costs were a little higher than average for units in shared buildings.
- 17,919 new housing units were authorized in Idaho in 2023.
- 12,081 or 67.4% of units were single family homes.
- The average permit for buildings included 1.4 housing units each.
- Buildings with five (5) units or more averaged 26.8 units per building.
- 96.3% of buildings authorized in Idaho were single family homes.
- 1.5% of buildings authorized had 5+ units; 28.0% of all units authorized were in these buildings.
- The valuation for the average single family home build in Idaho was $289,506 (down 4.95% YoY).
- In buildings with 5+ units, the valuation per unit was $160,597 (up 0.22%).
- New residential build permits in Idaho had a total valuation of $4.42 billion in 2023, down 5.84% YoY.

Illinois Housing & Build Permits
New housing authorizations in Illinois represented 1.12% of nationwide permits issued in 2023; construction costs per unit were higher than the national average.
- 16,863 new housing units were authorized in Illinois in 2023.
- 9,554 or 56.7% of units were single family homes.
- The average permit for buildings included 1.6 housing units each.
- Buildings with five (5) units or more averaged 18.5 units per building.
- 92.1% of buildings authorized in Illinois were single family homes.
- 3.1% of buildings authorized had 5+ units; 35.6% of all units authorized were in these buildings.
- The valuation for the average single family home build in Illinois was $338,989 (up 7.39% YoY).
- In buildings with 5+ units, the valuation per unit was $173,367 (up 15.7%).
- New residential build permits in Illinois had a total valuation of $4.52 billion in 2023, down 4.82% YoY.
Indiana Housing & Build Permits
New housing authorizations in Indiana represented 1.74% of nationwide permits issued in 2023; construction costs per unit were higher than the national average.
- 27,055 new housing units were authorized in Indiana in 2023.
- 17,046 or 63.0% of units were single family homes.
- The average permit for buildings included 1.5 housing units each.
- Buildings with five (5) units or more averaged 28.3 units per building.
- 96.3% of buildings authorized in Indiana were single family homes.
- 1.8% of buildings authorized had 5+ units; 34.2% of all units authorized were in these buildings.
- The valuation for the average single family home build in Indiana was $349,712 (up 8.08% YoY).
- In buildings with 5+ units, the valuation per unit was $172,595 (up 46.8%).
- New residential build permits in Indiana had a total valuation of $7.70 billion in 2023, up 6.94% YoY.
Iowa Housing & Build Permits
New housing authorizations in Iowa represented 0.74% of nationwide permits issued in 2023; construction costs per unit were higher than the national average.
- 11,230 new housing units were authorized in Iowa in 2023.
- 7,421 or 66.1% of units were single family homes.
- The average permit for buildings included 1.4 housing units each.
- Buildings with five (5) units or more averaged 24.8 units per building.
- 94.7% of buildings authorized in Iowa were single family homes.
- 1.6% of buildings authorized had 5+ units; 27.2% of all units authorized were in these buildings.
- The valuation for the average single family home build in Iowa was $334,201 (up 8.83% YoY).
- In buildings with 5+ units, the valuation per unit was $157,126 (up 2.62%).
- New residential build permits in Iowa had a total valuation of $3.11 billion in 2023, down 1.67% YoY.
Kansas Housing & Build Permits
New housing authorizations in Kansas represented 0.63% of nationwide permits issued in 2023; construction costs per unit were higher than the national average.
- 9,504 new housing units were authorized in Kansas in 2023.
- 4,927 or 51.8% of units were single family homes.
- The average permit for buildings included 1.6 housing units each.
- Buildings with five (5) units or more averaged 30.5 units per building.
- 84.2% of buildings authorized in Kansas were single family homes.
- 1.6% of buildings authorized had 5+ units; 29.9% of all units authorized were in these buildings.
- The valuation for the average single family home build in Kansas was $349,208 (up 2.29% YoY).
- In buildings with 5+ units, the valuation per unit was $170,192 (up 13.0%).
- New residential build permits in Kansas had a total valuation of $2.46 billion in 2023, down 1.47% YoY.
Kentucky Housing & Build Permits
New housing authorizations in Kentucky represented 1.02% of nationwide permits issued in 2023; construction costs per unit were lower than the national average.
- 15,415 new housing units were authorized in Kentucky in 2023.
- 7,826 or 50.8% of units were single family homes.
- The average permit for buildings included 1.8 housing units each.
- Buildings with five (5) units or more averaged 19.3 units per building.
- 91.0% of buildings authorized in Kentucky were single family homes.
- 3.9% of buildings authorized had 5+ units; 41.9% of all units authorized were in these buildings.
- The valuation for the average single family home build in Kentucky was $268,290 (up 4.89% YoY).
- In buildings with 5+ units, the valuation per unit was $119,635 (down 33.1%).
- New residential build permits in Kentucky had a total valuation of $3.01 billion in 2023, down 9.33% YoY.
Louisiana Housing & Build Permits
New housing authorizations in Louisiana represented 0.94% of nationwide permits issued in 2023; construction costs per unit were lower than the national average.
- 14,247 new housing units were authorized in Louisiana in 2023.
- 11,243 or 78.9% of units were single family homes.
- The average permit for buildings included 1.2 housing units each.
- Buildings with five (5) units or more averaged 25.2 units per building.
- 96.5% of buildings authorized in Louisiana were single family homes.
- 0.8% of buildings authorized had 5+ units; 16.6% of all units authorized were in these buildings.
- The valuation for the average single family home build in Louisiana was $248,141 (0.68% YoY).
- In buildings with 5+ units, the valuation per unit was $155,493 (17.1%).
- New residential build permits in Louisiana had a total valuation of $3.24 billion in 2023, down 12.7% YoY.
Maine Housing & Build Permits
New housing authorizations in Maine represented 0.41% of nationwide permits issued in 2023; single-family home construction costs per unit were higher than the national average, and costs were lower than average for units in shared buildings.
- 6,183 new housing units were authorized in Maine in 2023.
- 4,540 or 73.4% of units were single family homes.
- The average permit for buildings included 1.3 housing units each.
- Buildings with five (5) units or more averaged 14.1 units per building.
- 94.9% of buildings authorized in Maine were single family homes.
- 1.9% of buildings authorized had 5+ units; 21.1% of all units authorized were in these buildings.
- The valuation for the average single family home build in Maine was $304,256 (up 9.59% YoY).
- In buildings with 5+ units, the valuation per unit was $129,298 (down 4.38%).
- New residential build permits in Maine had a total valuation of $1.61 billion in 2023, down 3.45% YoY.
Maryland Housing & Build Permits
New housing authorizations in Maryland represented 1.22% of nationwide permits issued in 2023; construction costs per unit were lower than the national average.
- 18,453 new housing units were authorized in Maryland in 2023.
- 10,490 or 56.8% of units were single family homes.
- The average permit for buildings included 1.7 housing units each.
- Buildings with five (5) units or more averaged 51.9 units per building.
- 98.4% of buildings authorized in Maryland were single family homes.
- 1.4% of buildings authorized had 5+ units; 42.8% of all units authorized were in these buildings.
- The valuation for the average single family home build in Maryland was $279,523 (down 0.86% YoY).
- In buildings with 5+ units, the valuation per unit was $169,747 (up 23.1%).
- New residential build permits in Maryland had a total valuation of $4.28 billion in 2023, down 7.11% YoY.
Massachusetts Housing & Build Permits
New housing authorizations in Massachusetts represented 0.87% of nationwide permits issued in 2023; construction costs per unit were much higher than the national average.
- 13,214 new housing units were authorized in Massachusetts in 2023.
- 5,076 or 38.4% of units were single family homes.
- The average permit for buildings included 2.3 housing units each.
- Buildings with five (5) units or more averaged 26.7 units per building.
- 89.1% of buildings authorized in Massachusetts were single family homes.
- 4.8% of buildings authorized had 5+ units; 55.2% of all units authorized were in these buildings.
- The valuation for the average single family home build in Massachusetts was $468,790 (up 7.72% YoY).
- In buildings with 5+ units, the valuation per unit was $250,191 (4.75%).
- New residential build permits in Massachusetts had a total valuation of $4.42 billion in 2023, down 15.5% YoY.
Michigan Housing & Build Permits
New housing authorizations in Michigan represented 1.36% of nationwide permits issued in 2023; construction costs per unit were higher than the national average.
- 20,592 new housing units were authorized in Michigan in 2023.
- 14,413 or 70.0% of units were single family homes.
- The average permit for buildings included 1.4 housing units each.
- Buildings with five (5) units or more averaged 16.4 units per building.
- 95.3% of buildings authorized in Michigan were single family homes.
- 2.1% of buildings authorized had 5+ units; 25.1% of all units authorized were in these buildings.
- The valuation for the average single family home build in Michigan was $311,106 (down 1.49% YoY).
- In buildings with 5+ units, the valuation per unit was $193,960 (up 12.0%).
- New residential build permits in Michigan had a total valuation of $5.65 billion in 2023, down 3.78% YoY.
Minnesota Housing & Build Permits
New housing authorizations in Minnesota represented 1.70% of nationwide permits issued in 2023; construction costs per unit were higher than the national average.
- 25,667 new housing units were authorized in Minnesota in 2023.
- 12,770 or 49.8% of units were single family homes.
- The average permit for buildings included 1.9 housing units each.
- Buildings with five (5) units or more averaged 45.0 units per building.
- 96.5% of buildings authorized in Minnesota were single family homes.
- 2.1% of buildings authorized had 5+ units; 48.4% of all units authorized were in these buildings.
- The valuation for the average single family home build in Minnesota was $338,380 (up 2.61% YoY).
- In buildings with 5+ units, the valuation per unit was $182,689 (up 4.65%).
- New residential build permits in Minnesota had a total valuation of $6.69 billion in 2023, down 11.3% YoY.
Mississippi Housing & Build Permits
New housing authorizations in Mississippi represented 0.51% of nationwide permits issued in 2023; construction costs per unit were lower than the national average.
- 7,700 new housing units were authorized in Mississippi in 2023.
- 7,145 or 92.8% of units were single family homes.
- The average permit for buildings included 1.1 housing units each.
- Buildings with five (5) units or more averaged 8.2 units per building.
- 98.5% of buildings authorized in Mississippi were single family homes.
- 0.7% of buildings authorized had 5+ units; 5.68% of all units authorized were in these buildings.
- The valuation for the average single family home build in Mississippi was $198,943 (up 0.76% YoY).
- In buildings with 5+ units, the valuation per unit was $92,025 (up 63.6%).
- New residential build permits in Mississippi had a total valuation of $1.48 billion in 2023, up 4.29% YoY.
Missouri Housing & Build Permits
New housing authorizations in Missouri represented 1.11% of nationwide permits issued in 2023; single-family home construction costs per unit were higher than the national average, and costs were lower than average for units in shared buildings.
- 16,781 new housing units were authorized in Missouri in 2023.
- 11,022 or 65.7% of units were single family homes.
- The average permit for buildings included 1.4 housing units each.
- Buildings with five (5) units or more averaged 23.8 units per building.
- 94.3% of buildings authorized in Missouri were single family homes.
- 1.6% of buildings authorized had 5+ units; 27.1% of all units authorized were in these buildings.
- The valuation for the average single family home build in Missouri was $317,195 (up 3.71% YoY).
- In buildings with 5+ units, the valuation per unit was $129,607 (down 5.73%).
- New residential build permits in Missouri had a total valuation of $4.27 billion in 2023, down 11.8% YoY.
Montana Housing & Build Permits
New housing authorizations in Montana represented 0.28% of nationwide permits issued in 2023; single-family home construction costs per unit were higher than the national average, and costs were lower than average for units in shared buildings.
- 4,307 new housing units were authorized in Montana in 2023.
- 2,274 or 52.8% of units were single family homes.
- The average permit for buildings included 1.7 housing units each.
- Buildings with five (5) units or more averaged 26.0 units per building.
- 92.1% of buildings authorized in Montana were single family homes.
- 2.6% of buildings authorized had 5+ units; 39.3% of all units authorized were in these buildings.
- The valuation for the average single family home build in Montana was $331,157 (up 24.5% YoY).
- In buildings with 5+ units, the valuation per unit was $125,924 (up 0.57%).
- New residential build permits in Montana had a total valuation of $1.04 billion in 2023, down 19.0% YoY.
Nebraska Housing & Build Permits
New housing authorizations in Nebraska represented 0.59% of nationwide permits issued in 2023; construction costs per unit were lower than the national average.
- 8,877 new housing units were authorized in Nebraska in 2023.
- 4,666 or 52.6% of units were single family homes.
- The average permit for buildings included 1.8 housing units each.
- Buildings with five (5) units or more averaged 22.6 units per building.
- 93.5% of buildings authorized in Nebraska were single family homes.
- 3.4% of buildings authorized had 5+ units; 43.2% of all units authorized were in these buildings.
- The valuation for the average single family home build in Nebraska was $262,219 (down 0.20% YoY).
- In buildings with 5+ units, the valuation per unit was $108,197 (up 26.6%).
- New residential build permits in Nebraska had a total valuation of $1.70 billion in 2023, down 9.12% YoY.
Nevada Housing & Build Permits
New housing authorizations in Nevada represented 1.22% of nationwide permits issued in 2023; construction costs per unit were comparable to the national average.
- 18,451 new housing units were authorized in Nevada in 2023.
- 13,039 or 70.7% of units were single family homes.
- The average permit for buildings included 1.4 housing units each.
- Buildings with five (5) units or more averaged 21.6 units per building.
- 97.1% of buildings authorized in Nevada were single family homes.
- 1.7% of buildings authorized had 5+ units; 26.9% of all units authorized were in these buildings.
- The valuation for the average single family home build in Nevada was $297,471 (up 4.00% YoY).
- In buildings with 5+ units, the valuation per unit was $149,217 (up 33.8%).
- New residential build permits in Nevada had a total valuation of $4.69 billion in 2023, up 6.20% YoY.
New Hampshire Housing & Build Permits
New housing authorizations in New Hampshire represented 0.30% of nationwide permits issued in 2023; construction costs per unit were higher than the national average.
- 4,555 new housing units were authorized in New Hampshire in 2023.
- 2,969 or 65.2% of units were single family homes.
- The average permit for buildings included 1.4 housing units each.
- Buildings with five (5) units or more averaged 27.1 units per building.
- 94.0% of buildings authorized in New Hampshire were single family homes.
- 1.5% of buildings authorized had 5+ units; 27.4% of all units authorized were in these buildings.
- The valuation for the average single family home build in New Hampshire was $361,421 (up 2.61% YoY).
- In buildings with 5+ units, the valuation per unit was $186,274 (up 16.9%).
- New residential build permits in New Hampshire had a total valuation of $1.38 billion in 2023, up 0.15% YoY.
New Jersey Housing & Build Permits
New housing authorizations in New Jersey represented 2.17% of nationwide permits issued in 2023; construction costs per unit were higher than the national average.
- 32,840 new housing units were authorized in New Jersey in 2023.
- 13.228 or 40.3% of units were single family homes.
- The average permit for buildings included 2.2 housing units each.
- Buildings with five (5) units or more averaged 17.8 units per building.
- 87.4% of buildings authorized in New Jersey were single family homes.
- 6.5% of buildings authorized had 5+ units; 53.2% of all units authorized were in these buildings.
- The valuation for the average single family home build in New Jersey was $219,204 (up 0.27% YoY).
- In buildings with 5+ units, the valuation per unit was $113,996 (down 16.7%).
- New residential build permits in New Jersey had a total valuation of $5.16 billion in 2023, down 15.9% YoY.
New Mexico Housing & Build Permits
New housing authorizations in New Mexico represented 0.56% of nationwide permits issued in 2023; single-family home construction costs per unit were higher than the national average, and costs were lower than average for units in shared buildings.
- 8,511 new housing units were authorized in New Mexico in 2023.
- 6,835 or 80.3% of units were single family homes.
- The average permit for buildings included 1.2 housing units each.
- Buildings with five (5) units or more averaged 26.8 units per building.
- 98.3% of buildings authorized in New Mexico were single family homes.
- 0.8% of buildings authorized had 5+ units; 18.0% of all units authorized were in these buildings.
- The valuation for the average single family home build in New Mexico was $335,453 (up 47.7% YoY).
- In buildings with 5+ units, the valuation per unit was $123,296 (up 19.1%).
- New residential build permits in New Mexico had a total valuation of $2.50 billion in 2023, up 40.5% YoY.
New York Housing & Build Permits
New housing authorizations in New York represented 3.23% of nationwide permits issued in 2023; single-family home construction costs per unit were much higher than the national average, and costs were a bit higher than average for units in shared buildings.
- 48,807 new housing units were authorized in New York in 2023.
- 9,677 or 19.8% of units were single family homes.
- The average permit for buildings included 4.3 housing units each.
- Buildings with five (5) units or more averaged 44.9 units per building.
- 86.2% of buildings authorized in New York were single family homes.
- 7.4% of buildings authorized had 5+ units; 76.7% of all units authorized were in these buildings.
- The valuation for the average single family home build in New York was $401,187 (up 4.25% YoY).
- In buildings with 5+ units, the valuation per unit was $161,340 (down 0.21%).
- New residential build permits in New York had a total valuation of $10.19 billion in 2023, down 8.36% YoY.

North Carolina Housing & Build Permits
New housing authorizations in North Carolina represented 6.54% of nationwide permits issued in 2023; construction costs per unit were lower than the national average.
- 98,853 new housing units were authorized in North Carolina in 2023.
- 65,860 or 66.6% of units were single family homes.
- The average permit for buildings included 1.5 housing units each.
- Buildings with five (5) units or more averaged 38.2 units per building.
- 98.0% of buildings authorized in North Carolina were single family homes.
- 1.2% of buildings authorized had 5+ units; 32.3% of all units authorized were in these buildings.
- The valuation for the average single family home build in North Carolina was $277,998 (up 0.15% YoY).
- In buildings with 5+ units, the valuation per unit was $133,000 (down 0.85%).
- New residential build permits in North Carolina had a total valuation of $22.74 billion in 2023, up 3.38% YoY.
North Dakota Housing & Build Permits
New housing authorizations in North Dakota represented 0.17% of nationwide permits issued in 2023; construction costs per unit were higher than the national average.
- 2,618 new housing units were authorized in North Dakota in 2023.
- 1,499 or 57.3% of units were single family homes.
- The average permit for buildings included 1.7 housing units each.
- Buildings with five (5) units or more averaged 82.1 units per building.
- 95.3% of buildings authorized in North Dakota were single family homes.
- 0.8% of buildings authorized had 5+ units; 37.6% of all units authorized were in these buildings.
- The valuation for the average single family home build in North Dakota was $334,469 (up 3.46% YoY).
- In buildings with 5+ units, the valuation per unit was $161,482 (up 17.2%).
- New residential build permits in North Dakota had a total valuation of $689 million in 2023, down 17.9% YoY.
Ohio Housing & Build Permits
New housing authorizations in Ohio represented 1.81% of nationwide permits issued in 2023; single-family home construction costs per unit were higher than the national average, and costs were lower than average for units in shared buildings.
- 27,318 new housing units were authorized in Ohio in 2023.
- 16,009 or 58.6% of units were single family homes.
- The average permit for buildings included 1.6 housing units each.
- Buildings with five (5) units or more averaged 24.0 units per building.
- 94.0% of buildings authorized in Ohio were single family homes.
- 2.4% of buildings authorized had 5+ units; 35.3% of all units authorized were in these buildings.
- The valuation for the average single family home build in Ohio was $347,409 (down 0.69% YoY).
- In buildings with 5+ units, the valuation per unit was $118,671 (up 8.10%).
- New residential build permits in Ohio had a total valuation of $6.97 billion in 2023, down 8.17% YoY.
Oklahoma Housing & Build Permits
New housing authorizations in Oklahoma represented 0.89% of nationwide permits issued in 2023; construction costs per unit were lower than the national average.
- 13,405 new housing units were authorized in Oklahoma in 2023.
- 10,325 or 77.0% of units were single family homes.
- The average permit for buildings included 1.2 housing units each.
- Buildings with five (5) units or more averaged 19.2 units per building.
- 94.6% of buildings authorized in Oklahoma were single family homes.
- 0.9% of buildings authorized had 5+ units; 14.7% of all units authorized were in these buildings.
- The valuation for the average single family home build in Oklahoma was $276,413 (up 0.20% YoY).
- In buildings with 5+ units, the valuation per unit was $102,371 (down 26.4%).
- New residential build permits in Oklahoma had a total valuation of $3.22 billion in 2023, down 5.36% YoY.
Oregon Housing & Build Permits
New housing authorizations in Oregon represented 1.17% of nationwide permits issued in 2023; construction costs per unit were higher than the national average.
- 17,697 new housing units were authorized in Oregon in 2023.
- 9,797 or 55.4% of units were single family homes.
- The average permit for buildings included 1.7 housing units each.
- Buildings with five (5) units or more averaged 23.1 units per building.
- 94.0% of buildings authorized in Oregon were single family homes.
- 3.0% of buildings authorized had 5+ units; 40.5% of all units authorized were in these buildings.
- The valuation for the average single family home build in Oregon was $341,579 (up 8.57% YoY).
- In buildings with 5+ units, the valuation per unit was $159,638 (up 23.1%).
- New residential build permits in Oregon had a total valuation of $4.65 billion in 2023, up 1.59% YoY.
Pennsylvania Housing & Build Permits
New housing authorizations in Pennsylvania represented 1.68% of nationwide permits issued in 2023; single-family home construction costs per unit were higher than the national average, and costs were lower than average for units in shared buildings.
- 25,320 new housing units were authorized in Pennsylvania in 2023.
- 15,912 or 62.8% of units were single family homes.
- The average permit for buildings included 1.5 housing units each.
- Buildings with five (5) units or more averaged 26.5 units per building.
- 96.0% of buildings authorized in Pennsylvania were single family homes.
- 1.9% of buildings authorized had 5+ units; 33.4% of all units authorized were in these buildings.
- The valuation for the average single family home build in Pennsylvania was $301,974 (up 4.64% YoY).
- In buildings with 5+ units, the valuation per unit was $126,212 (down 6.78%).
- New residential build permits in Pennsylvania had a total valuation of $6.02 billion in 2023, down 9.00% YoY.
Puerto Rico Housing & Build Permits
2023 housing permit data for Puerto Rico is unavailable; In 2022, construction costs per single family home were much less expensive but units in larger buildings were much more costly than the national average.
- 3,999 new housing units were authorized in Puerto Rico in 2022.
- 3,754 or 93.9% of units were single family homes.
- The average permit for buildings included 1.1 housing units each.
- Buildings with five (5) units or more averaged 15.9 units per building.
- 99.4% of buildings authorized in Puerto Rico were single family homes.
- 0.4% of buildings authorized had 5+ units; 5.6% of all units authorized were in these buildings.
- The valuation for the average single family home build in Puerto Rico was $134,916 (2021 data unavailable).
- In buildings with 5+ units, the valuation per unit was $232,548.
- New residential build permits in Puerto Rico had a total valuation of $559 million in 2022.
Rhode Island Housing & Build Permits
New housing authorizations in Rhode Island represented 0.08% of nationwide permits issued in 2023; single-family home construction costs per unit were higher than the national average, and costs were lower than average for units in shared buildings.
- 1,169 new housing units were authorized in Rhode Island in 2023.
- 709 or 60.7% of units were single family homes.
- The average permit for buildings included 1.5 housing units each.
- Buildings with five (5) units or more averaged 24.4 units per building.
- 89.9% of buildings authorized in Rhode Island were single family homes.
- 1.6% of buildings authorized had 5+ units; 27.1% of all units authorized were in these buildings.
- The valuation for the average single family home build in Rhode Island was $324,642 (down 5.16% YoY).
- In buildings with 5+ units, the valuation per unit was $102,394 (down 26.2%).
- New residential build permits in Rhode Island had a total valuation of $282 million in 2023, down 27.2% YoY.
South Carolina Housing & Build Permits
New housing authorizations in South Carolina represented 2.81% of nationwide permits issued in 2023; construction costs per unit were lower than the national average.
- 42,474 new housing units were authorized in South Carolina in 2023.
- 37,163 or 87.5% of units were single family homes.
- The average permit for buildings included 1.1 housing units each.
- Buildings with five (5) units or more averaged 12.3 units per building.
- 97.8% of buildings authorized in South Carolina were single family homes.
- 0.9% of buildings authorized had 5+ units; 9.6% of all units authorized were in these buildings.
- The valuation for the average single family home build in South Carolina was $286,983 (down 0.56% YoY).
- In buildings with 5+ units, the valuation per unit was $122,704 (up 4.25%).
- New residential build permits in South Carolina had a total valuation of $11.28 billion in 2023, down 5.31% YoY.
South Dakota Housing & Build Permits
New housing authorizations in South Dakota represented 0.47% of nationwide permits issued in 2023; construction costs per unit were lower than the national average.
- 7,072 new housing units were authorized in South Dakota in 2023.
- 3,252 or 46.0% of units were single family homes.
- The average permit for buildings included 2.0 housing units each.
- Buildings with five (5) units or more averaged 22.9 units per building.
- 91.3% of buildings authorized in South Dakota were single family homes.
- 4.1% of buildings authorized had 5+ units; 47.7% of all units authorized were in these buildings.
- The valuation for the average single family home build in South Dakota was $294,555 (up 4.60% YoY).
- In buildings with 5+ units, the valuation per unit was $129,650 (down 1.50%).
- New residential build permits in South Dakota had a total valuation of $1.46 billion in 2023, down 20.3% YoY.
Tennessee Housing & Build Permits
New housing authorizations in Tennessee represented 3.14% of nationwide permits issued in 2023; construction costs per unit were lower than the national average.
- 47,463 new housing units were authorized in Tennessee in 2023.
- 31,293 or 65.9% of units were single family homes.
- The average permit for buildings included 1.5 housing units each.
- Buildings with five (5) units or more averaged 29.3 units per building.
- 97.1% of buildings authorized in Tennessee were single family homes.
- 1.6% of buildings authorized had 5+ units; 31.7% of all units authorized were in these buildings.
- The valuation for the average single family home build in Tennessee was $293,421 (up 5.03% YoY).
- In buildings with 5+ units, the valuation per unit was $144,843 (up 11.3%).
- New residential build permits in Tennessee had a total valuation of $11.51 billion in 2023, down 2.36% YoY.
Texas Housing & Build Permits
New housing authorizations in Texas represented 15.4% of nationwide permits issued in 2023; construction costs per unit were lower than the national average.
- 232,373 new housing units were authorized in Texas in 2023.
- 149,860 or 64.5% of units were single family homes.
- The average permit for buildings included 1.5 housing units each.
- Buildings with five (5) units or more averaged 33.4 units per building.
- 96.3% of buildings authorized in Texas were single family homes.
- 1.4% of buildings authorized had 5+ units; 31.9% of all units authorized were in these buildings.
- The valuation for the average single family home build in Texas was $271,533 (up 5.59% YoY).
- In buildings with 5+ units, the valuation per unit was $122,398 (up 2.02%).
- New residential build permits in Texas had a total valuation of $50.83 billion in 2023, down 3.77% YoY.
Utah Housing & Build Permits
New housing authorizations in Utah represented 1.68% of nationwide permits issued in 2023; construction costs per unit were higher than the national average.
- 25,361 new housing units were authorized in Utah in 2023.
- 14,913 or 58.8% of units were single family homes.
- The average permit for buildings included 1.6 housing units each.
- Buildings with five (5) units or more averaged 23.1 units per building.
- 95.4% of buildings authorized in Utah were single family homes.
- 2.6% of buildings authorized had 5+ units; 37.5% of all units authorized were in these buildings.
- The valuation for the average single family home build in Utah was $337,468 (up 7.26% YoY).
- In buildings with 5+ units, the valuation per unit was $185,978 (up 20.2%).
- New residential build permits in Utah had a total valuation of $6.99 billion in 2023, down 12.6% YoY.
Vermont Housing & Build Permits
New housing authorizations in Vermont represented 0.16% of nationwide permits issued in 2023; single-family home construction costs per unit were higher than the national average, and costs were lower than average for units in shared buildings.
- 2,456 new housing units were authorized in Vermont in 2023.
- 1,303 or 53.1% of units were single family homes.
- The average permit for buildings included 1.7 housing units each.
- Buildings with five (5) units or more averaged 17.8 units per building.
- 90.5% of buildings authorized in Vermont were single family homes.
- 3.8% of buildings authorized had 5+ units; 39.2% of all units authorized were in these buildings.
- The valuation for the average single family home build in Vermont was $319,357 (up 6.32% YoY).
- In buildings with 5+ units, the valuation per unit was $130,040 (down 7.85%).
- New residential build permits in Vermont had a total valuation of $573 million in 2023, up 4.45% YoY.
Virginia Housing & Build Permits
New housing authorizations in Virginia represented 2.39% of nationwide permits issued in 2023; construction costs per unit were lower than the national average.
- 36,096 new housing units were authorized in Virginia in 2023.
- 21,321 or 59.1% of units were single family homes.
- The average permit for buildings included 1.6 housing units each.
- Buildings with five (5) units or more averaged 44.9 units per building.
- 97.5% of buildings authorized in Virginia were single family homes.
- 1.4% of buildings authorized had 5+ units; 39.4% of all units authorized were in these buildings.
- The valuation for the average single family home build in Virginia was $272,312 (down 0.33% YoY).
- In buildings with 5+ units, the valuation per unit was $109,094 (down 8.26%).
- New residential build permits in Virginia had a total valuation of $7.43 billion in 2023, down 7.01% YoY.
Virgin Islands Housing & Build Permits
New housing authorizations in Virgin Islands represented 0.02% of nationwide permits issued in 2023; construction costs for single family homes were lower than the national average.
- 354 new housing units were authorized in Virgin Islands in 2023.
- 207 or 58.5% of units were single family homes.
- The average permit for buildings included 1.3 housing units each.
- Zero (0) buildings included 5+ units.
- 74.7% of buildings authorized in Virgin Islands were single family homes.
- The valuation for the average single family home build in Virgin Islands was $243,899 (with no change YoY).
- New residential build permits in Virgin Islands had a total valuation of $96 million in 2023, up 61.4% YoY.
Washington Housing & Build Permits
New housing authorizations in Washington represented 2.45% of nationwide permits issued in 2023; single-family home construction costs per unit were higher than the national average, and costs were lower than average for units in shared buildings.
- 37,097 new housing units were authorized in Washington in 2023.
- 18,056 or 48.7% of units were single family homes.
- The average permit for buildings included 1.9 housing units each.
- Buildings with five (5) units or more averaged 30.0 units per building.
- 92.5% of buildings authorized in Washington were single family homes.
- 2.9% of buildings authorized had 5+ units; 45.4% of all units authorized were in these buildings.
- The valuation for the average single family home build in Washington was $362,834 (up 6.06% YoY).
- In buildings with 5+ units, the valuation per unit was $146,598 (up 3.22%).
- New residential build permits in Washington had a total valuation of $9.52 billion in 2023, down 15.2% YoY.
West Virginia Housing & Build Permits
New housing authorizations in West Virginia represented 0.27% of nationwide permits issued in 2023; construction costs were among the lowest in the country.
- 4,014 new housing units were authorized in West Virginia in 2023.
- 3,278 or 81.7% of units were single family homes.
- The average permit for buildings included 1.2 housing units each.
- Buildings with five (5) units or more averaged 22.9 units per building.
- 98.2% of buildings authorized in West Virginia were single family homes.
- 0.8% of buildings authorized had 5+ units; 16.0% of all units authorized were in these buildings.
- The valuation for the average single family home build in West Virginia was $217,653 (down 9.13% YoY).
- In buildings with 5+ units, the valuation per unit was $58,579 (down 52.0%).
- New residential build permits in West Virginia had a total valuation of $761 million in 2023, down 0.01% YoY.
Wisconsin Housing & Build Permits
New housing authorizations in Wisconsin represented 1.42% of nationwide permits issued in 2023; single-family home construction costs per unit were much than the national average, and costs were comparable to the average for units in shared buildings.
- 21,494 new housing units were authorized in Wisconsin in 2023.
- 11,465 or 53.3% of units were single family homes.
- The average permit for buildings included 1.7 housing units each.
- Buildings with five (5) units or more averaged 32.0 units per building.
- 91.2% of buildings authorized in Wisconsin were single family homes.
- 2.0% of buildings authorized had 5+ units; 38.3% of all units authorized were in these buildings.
- The valuation for the average single family home build in Wisconsin was $376,017 (up 2.56% YoY).
- In buildings with 5+ units, the valuation per unit was $154,012 (down 4.46%).
- New residential build permits in Wisconsin had a total valuation of $5.97 billion in 2023, up 2.00% YoY.
Wyoming Housing & Build Permits
New housing authorizations in Wyoming represented 0.11% of nationwide permits issued in 2023; single-family home construction costs per unit were much higher than the national average, and costs were lower than average for units in shared buildings.
- 1,681 new housing units were authorized in Wyoming in 2023.
- 1,418 or 84.4% of units were single family homes.
- The average permit for buildings included 1.1 housing units each.
- Buildings with five (5) units or more averaged 7.3 units per building.
- 94.7% of buildings authorized in Wyoming were single family homes.
- 0.5% of buildings authorized had 5+ units; 3.5% of all units authorized were in these buildings.
- The valuation for the average single family home build in Wyoming was $381,157 (down 28.2% YoY).
- In buildings with 5+ units, the valuation per unit was $116,966 (up 55.8%).
- New residential build permits in Wyoming had a total valuation of $575 million in 2023, down 48.8% YoY.
Housing Starts by Building Type
Rental property trends, such as rental vacancy rates and interstate migration statistics indicate fewer moves to single family homes.
- In 2023, single family homes made up 66.7% of new housing starts.
- Multi-family homes or those with 2 to 4 units made up 0.94% of new housing.
- Homes with 5 units or more made up 32.3% of new housing starts.
| Year | Building Type | Starts |
|---|---|---|
| 2023 | Single Family | 947,200 |
| 2 – 4 Units | 13,400 | |
| 5-or-more Units | 459,300 | |
| 2022 | Single Family | 1,005,200 |
| 2 – 4 Units | 16,400 | |
| 5-or-more Units | 531,000 | |
| 2021 | Single Family | 1,127,200 |
| 2 – 4 Units | 11,700 | |
| 5-or-more Units | 462,100 | |
| 2020 | Single Family | 990,500 |
| 2 – 4 Units | 12,300 | |
| 5-or-more Units | 376,800 | |
| 2019 | Single Family | 887,700 |
| 2 – 4 Units | 13,400 | |
| 5-or-more Units | 388,900 | |
| 2018 | Single Family | 875,800 |
| 2 – 4 Units | 13,900 | |
| 5-or-more Units | 360,300 | |
| 2017 | Single Family | 848,900 |
| 2 – 4 Units | 11,400 | |
| 5-or-more Units | 342,700 | |
| 2016 | Single Family | 781,500 |
| 2 – 4 Units | 11,500 | |
| 5-or-more Units | 380,800 |

Other New Housing Statistics
The annual number of single family housing starts increased every year between 2011 and 2021; 2022 and 2023 both saw annual declines.
- 83.3% of single family homes are detached.
- 72.2% are built with the intent to sell.
- Among multi-unit residential buildings, 2.75% are built with the intent to sell.
- The average single family home has more than twice the floor space (129.6% more) of the average apartment.
- 87.2% of new apartment housing is in buildings with 20 units or more.
- The square footage of the average single family home declined 2.98% (74ft2).
- The average new multi-family unit shrank 1.22% (13ft2).
| Building Type | Variable | Starts |
|---|---|---|
| Single Family | Built for Sale | 684,000 |
| Detached | 789,000 | |
| Average Size | 2,411 ft2 | |
| Multi-Family | Built for Sale | 13,000 |
| Built for Rental | 459,000 | |
| 2-4 Units | 16,000 | |
| 20+ Units | 412,000 | |
| Average Unit Size | 1,050 ft2 |
New Pending Housing
A building may be listed as “pending” indefinitely, making it difficult to gauge the efficiency of the construction industry based on the number of projects alone.
- 80% of single family housing projects begin within 8 weeks of authorization.
- 43% of single family projects break ground within a month of authorization.
- 6.1% don’t break ground for 4 months or more.
- In buildings with 2 units or more, 19% don’t break ground for 4 months or more.
- Buildings with 10 or more units are the most likely to take longer; 22% don’t break ground within 4 months of authorization.
- Buildings that take longer to break ground are more likely to be owner-built.
| Month | Total | SFH |
|---|---|---|
| January | 299,100 | 130,400 |
| February | 300,200 | 131,100 |
| March | 300,500 | 139,400 |
| April | 296,100 | 142,600 |
| May | 286,200 | 142,200 |
| June | 278,900 | 146,200 |
| July | 262,100 | 136,800 |
| August | 276,600 | 142,900 |
| September | 271,800 | 138,800 |
| October | 281,800 | 143,800 |
| November | 270,700 | 134,000 |
| December | 261,200 | 133,400 |
†Housing permits have been authorized but projects have not broken ground.